
Traders remain on edge as tension in the Middle East is at the threshold of a full out war in the region. Israeli response to the Iranian 200-missile attack last week seems near, with the US along with leaders from European and Arab states desperately trying to dissuade an attack on Iranian nuclear and oil facilities which could spark an even wider regional conflict and higher energy prices. Higher energy prices are a concern for President Biden and Vice President Harris with the US elections less than a month away.
Iranian officials have stated that any Israeli attack on Iran would be met with an unconventional response.
In Lebanon, Netanyahu has warned its neighbor that the country could face a long and devastating war as we have seen in Gaza, in the war against Hamas.
In the US hurricane Milton is set to hit Tampa with expected massive coastal flooding in its fury. The storm will also bring torrential rain, with some areas getting 18 inches, according to the US National Hurricane Center. Power outages lasting days or perhaps weeks are expected in the wake of the hurricane.
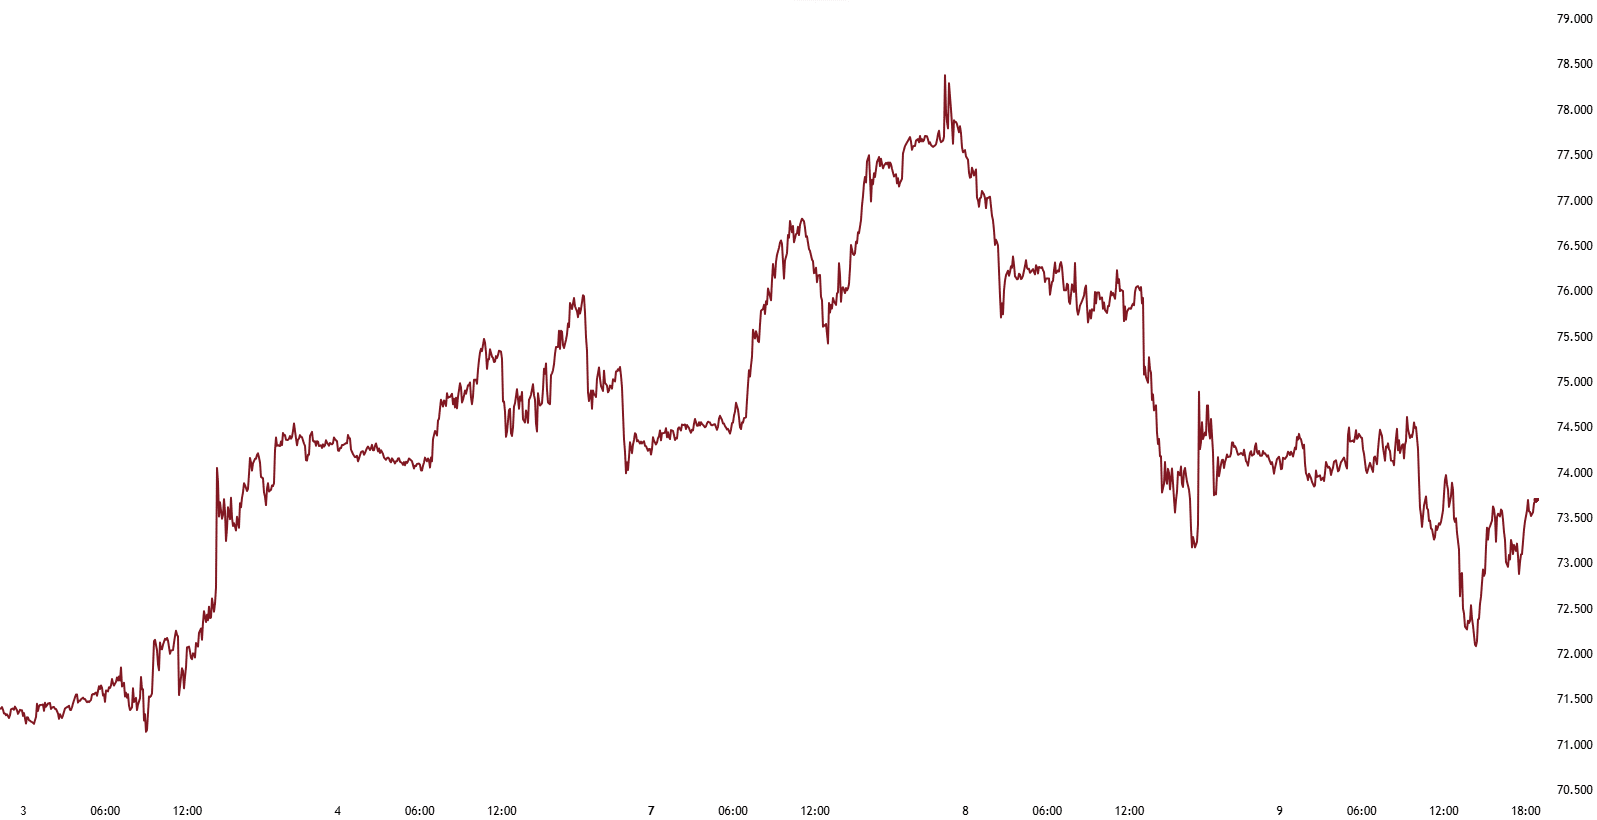
Figure 1. Benchmark Crude Oil Prices in Waiting Mode
US Crude inventories and production.
US commercial crude oil inventories with another significant increase in the week ending October 4 with a 5.8 million barrel-build. U.S. crude oil inventories are about 4 percent below the five-year average for this time of year and 1.5 million barrels lower than a year ago. U.S. crude oil refinery inputs averaged 15.6 million barrels per day during the week ending October 4, 2024, which was a 100 Kbpd less than the previous week`s average. Refineries operated at 86.7 percent of their operable capacity last week.
Figure 2. US Crude Stocks including SPR at 805.6 million Barrels.
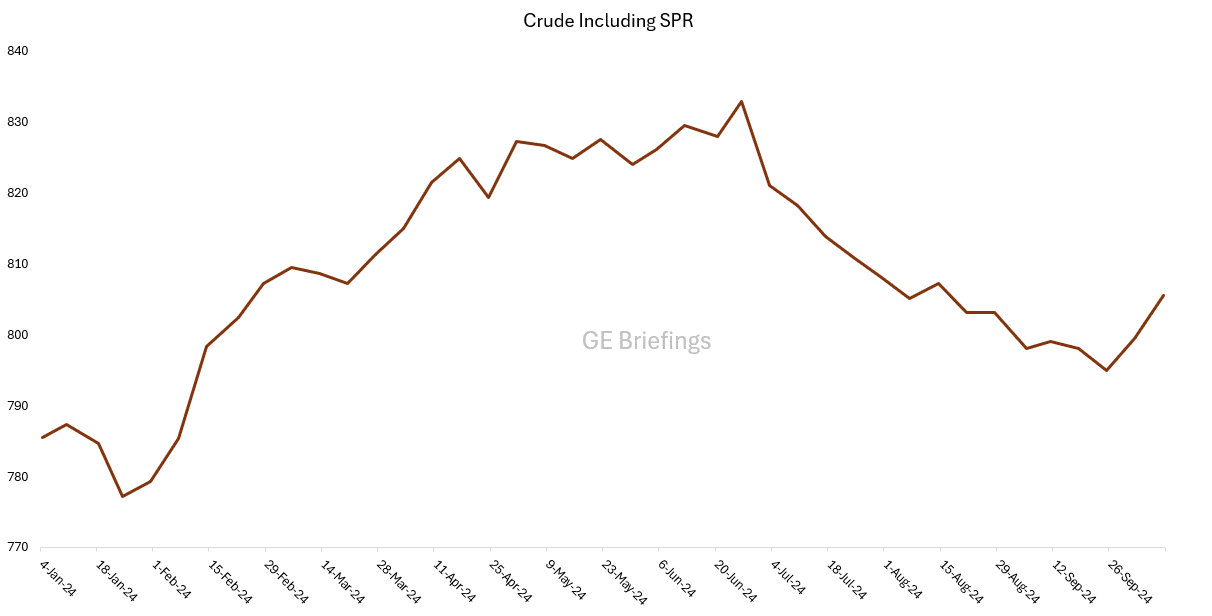
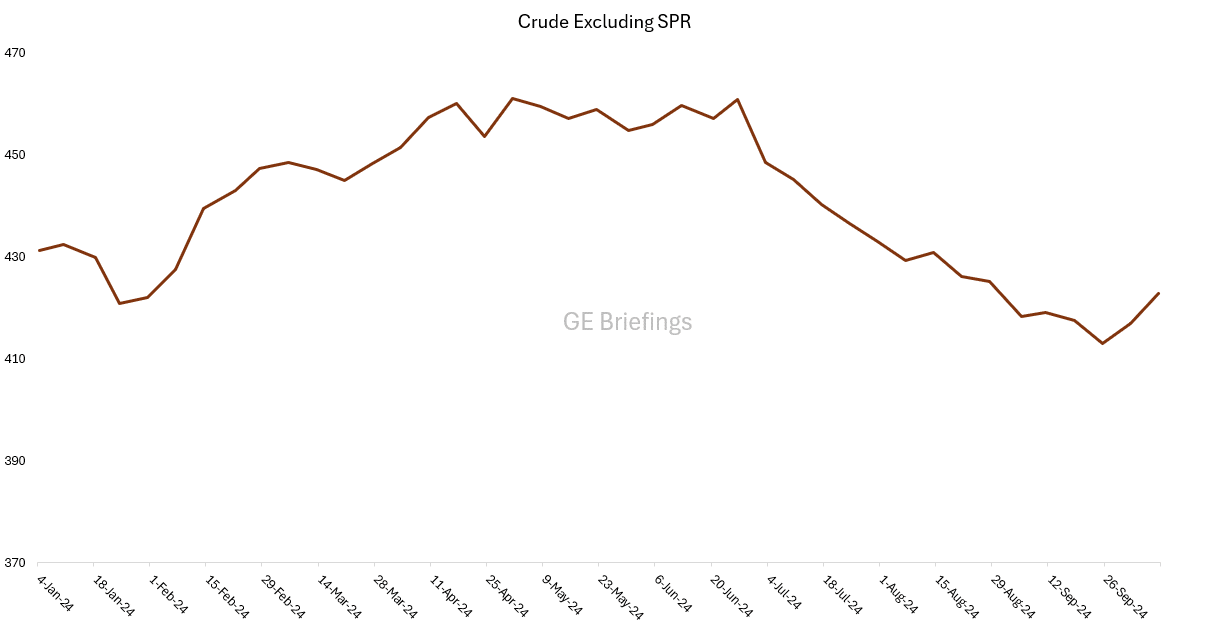
Figure 3. US Crude Stocks Excluding SPR at 422.7 million Barrels.
US Rig Activity.
A small decline in the total number of active rigs operating in the US according to Baker Hughes rig count. Down from a total of 587 active rigs, to 585 active rigs. Oil focused had yet another decrease last week, down from 484 to 479. Gas focused rigs increased by three from 99 to 102 active rigs. Miscellaneous rigs remained flat at four active rigs.
Figure 4. Active Oil Focused Rigs Decreased by Five. Active Rigs at 479.
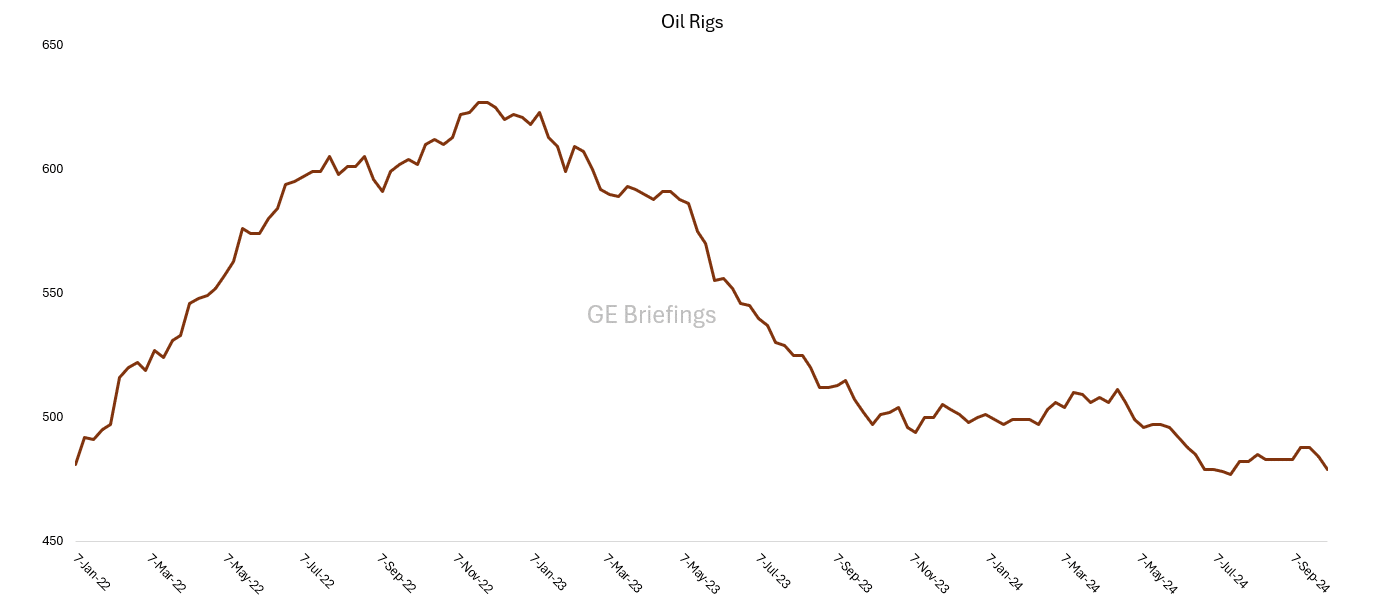
Figure 5. Gas Focused Rigs Increased From 99 to 102 Active Rigs.
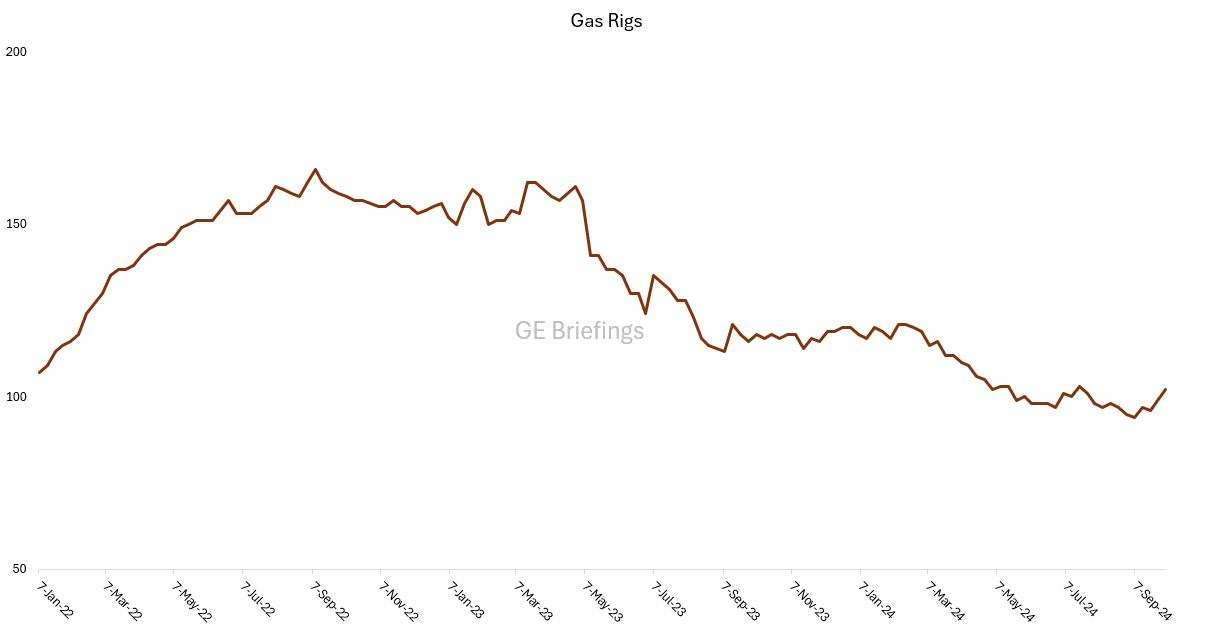
Figure 5. Total Active Rigs in the U.S. Dropped from 587 to 585.
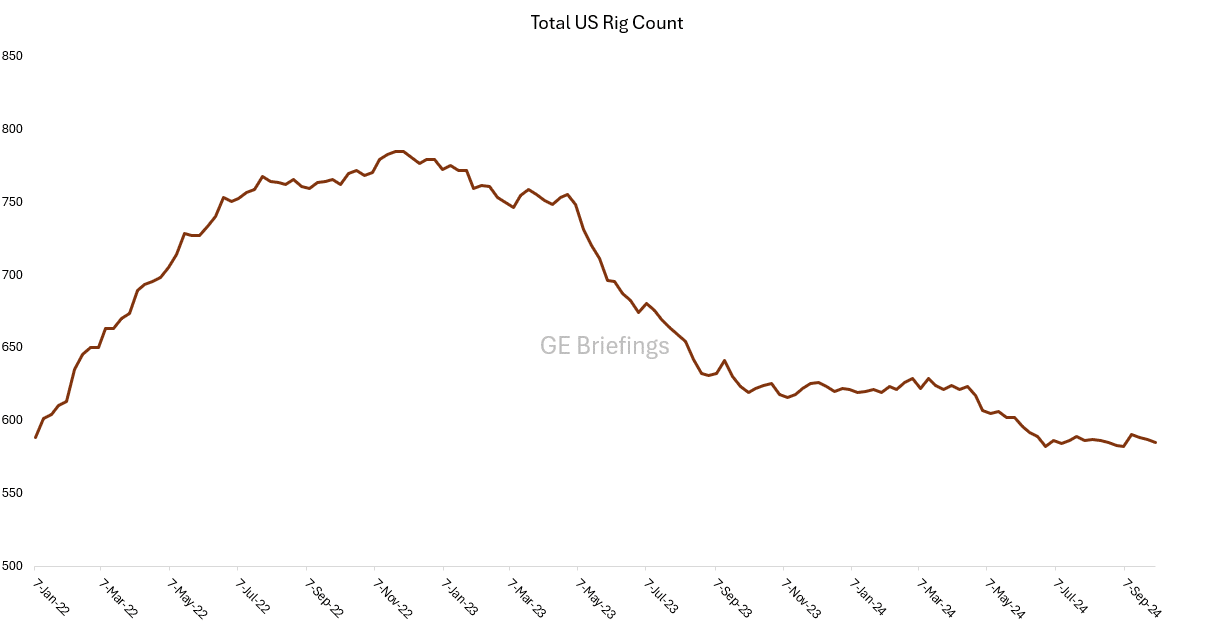
Figure 6. Rig Count in Major Basins.
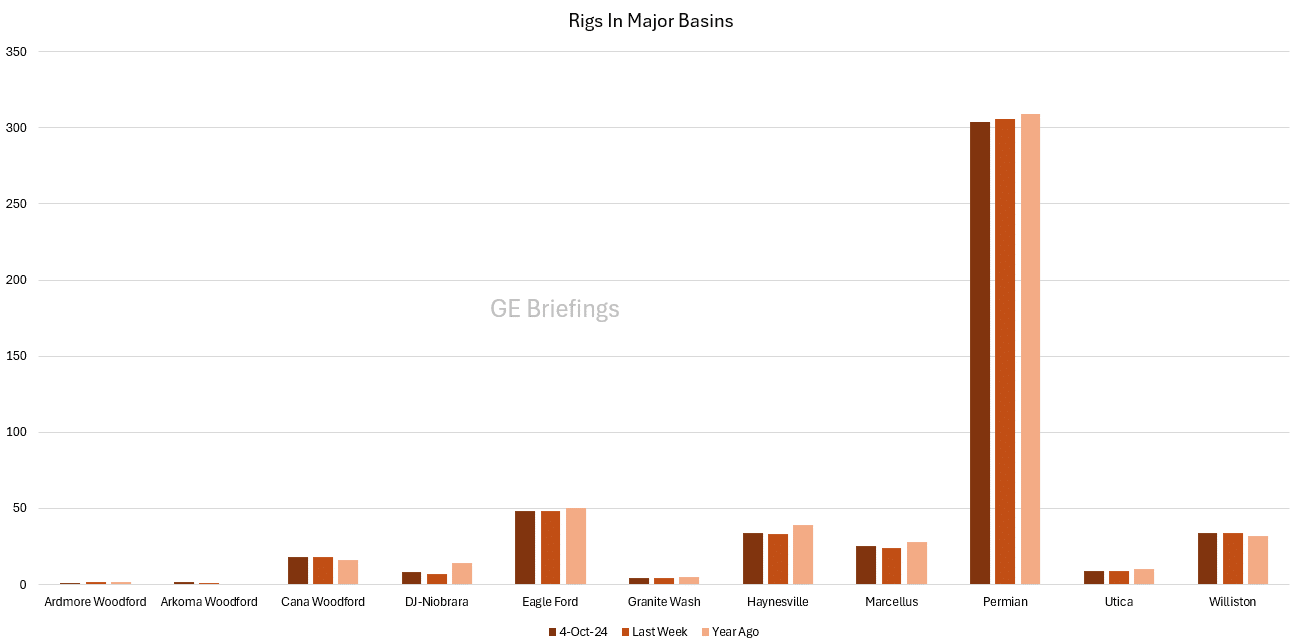
Baker Hughes has issued the rotary rig counts as a service to the petroleum industry since 1944, when Baker Hughes Tool Company began weekly counts of U.S. and Canadian drilling activity. Baker Hughes initiated the monthly international rig count in 1975. The North American rig count is released weekly at noon Central Time on the last day of the work week.
By the Numbers October 9, 2024
| New Data | Previous Week | Change +/- | |
| US Production | 13.4 million bpd | 13.3 million bpd | +100 kbpd |
| Crude Stocks Excluding SPR | 422.7 million barrels | 416.9 million barrels | +5.8 million barrels |
| Crude Stocks Including SPR | 805.6 million barrels | 799.5 million barrels | +6.1 million barrels |
| Refinery Inputs | 15.59 million bpd | 15.69 million bpd | -100 Kbpd |
| Active Rigs in the US | 585 Active Rigs | 587 Active Rigs | -2 |