Most OPEC+ delegates seem to be aligned together with the expectation of extending the production cut yet again. In the upcoming ministerial meeting on December 5, the OPEC-eights 2.2 million bpd cut is on the table for discussion. The cuts are set to hit the market gradually from January 1, 2025, with approximately 180 kbpd over a twelve-month period. With slower demand growth from China and Europe experts sees little to no room for additional barrels to be released.
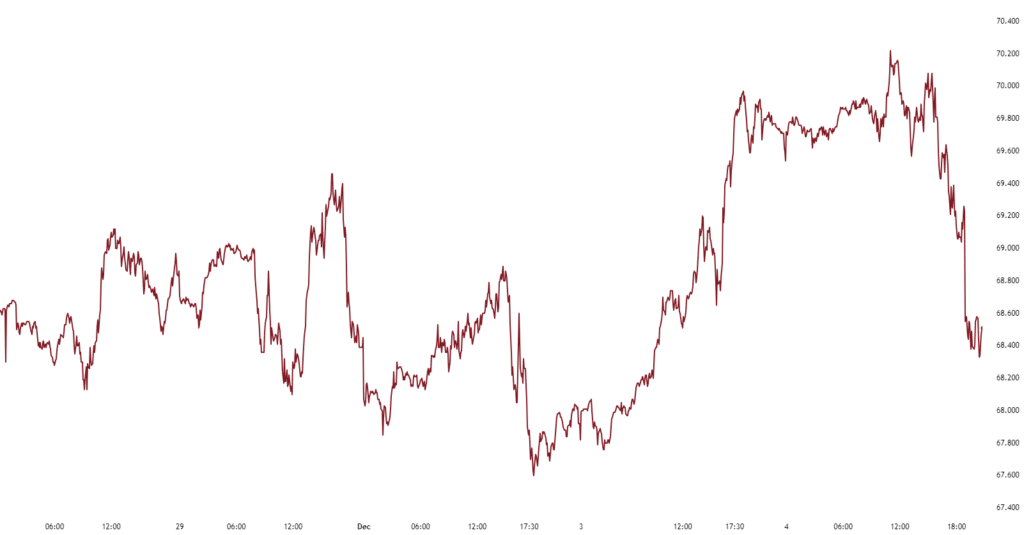
Oil prices edged higher on the news of larger than expected draw in US commercial crude inventories only to pull back again later in the session. Concerns about weakening demand despite the recent stronger than expected factory activity data out of China still weighs on crude prices.
Month | Last |
Crude Oil Jan 2025 | 68.56 |
Crude Oil Feb 2025 | 68.23 |
Crude Oil Mar 2025 | 68.00 |
Crude Oil Apr 2025 | 67.80 |
Crude Oil May 2025 | 67.63 |
Crude Oil Jun 2025 | 67.46 |
Crude Oil Jul 2025 | 67.27 |
Crude Oil Aug 2025 | 67.08 |
Crude Oil Sep 2025 | 66.84 |
Crude Oil Oct 2025 | 66.61 |
Crude Oil Nov 2025 | 66.38 |
Crude Oil Dec 2025 | 66.24 |
Crude Oil Jan 2026 | 66.00 |
US Crude inventories and production.
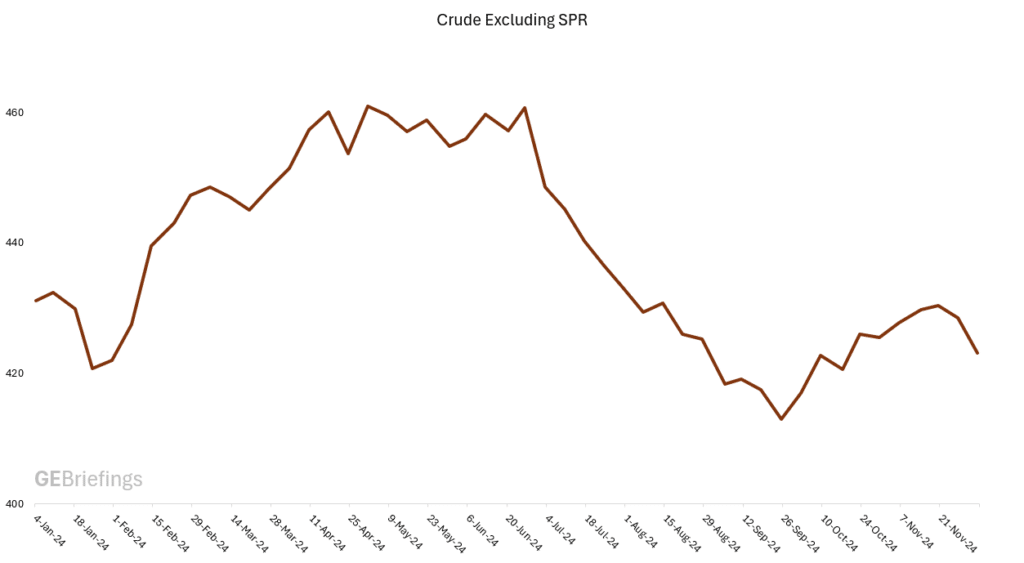
US commercial crude oil inventories decreased by 5.1 million barrels in the week ending November 29, with market forecasters predictions at 1.1- 1.5 million barrels decrease in crude stocks. U.S. crude oil inventories are about 5 percent below the five-year average for this time of year and 21.6 million barrels lower than a year ago. U.S. crude oil refinery inputs averaged 16.9 million barrels per day during the week ending November 29, 2024, which was 620 Kbpd more than the previous week`s average. Refineries operated at 93.3 percent of their operable capacity last week.
Figure 2. US Crude Stocks including SPR at 815.2 million Barrels.
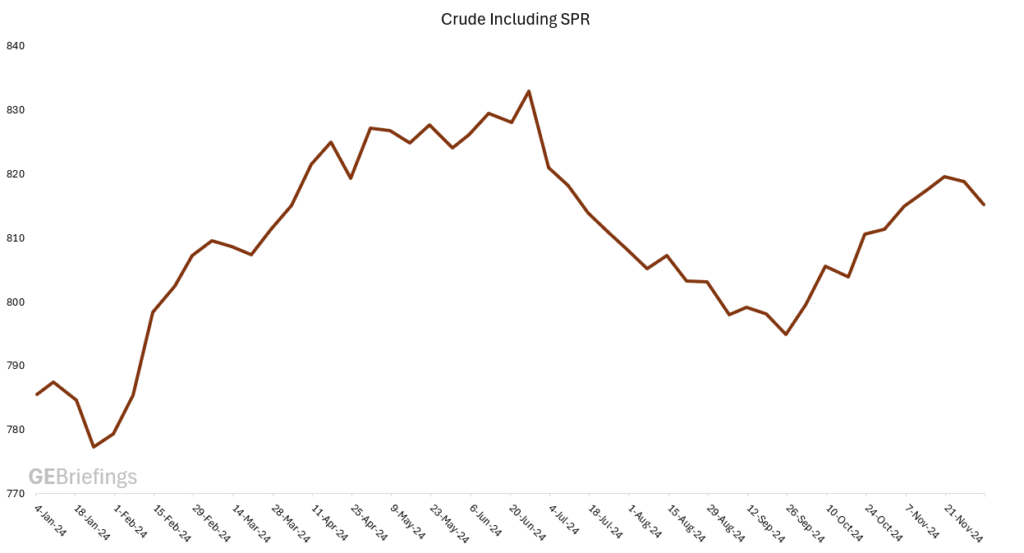
Figure 3. US Crude Stocks Excluding SPR at 423.4 million Barrels.
US Rig Activity.
The total number of active rigs operating in the US according to Baker Hughes rig count decreased by one last week, now at 582. Oil focused rigs decreased by two last week, now at 477 active rigs. Gas focused rigs increased by one, now at 100 active rigs. Miscellaneous rigs remained flat at five active rigs.
Figure 4. Active Oil Focused Rigs Decreased From 479 to 477.
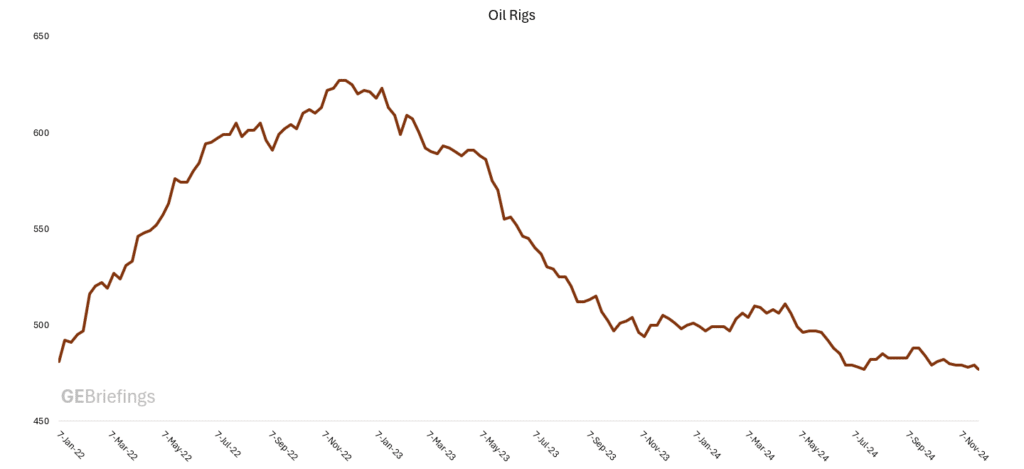
Figure 5. Gas Focused Rigs Increased from 99 to 100 Active Rigs
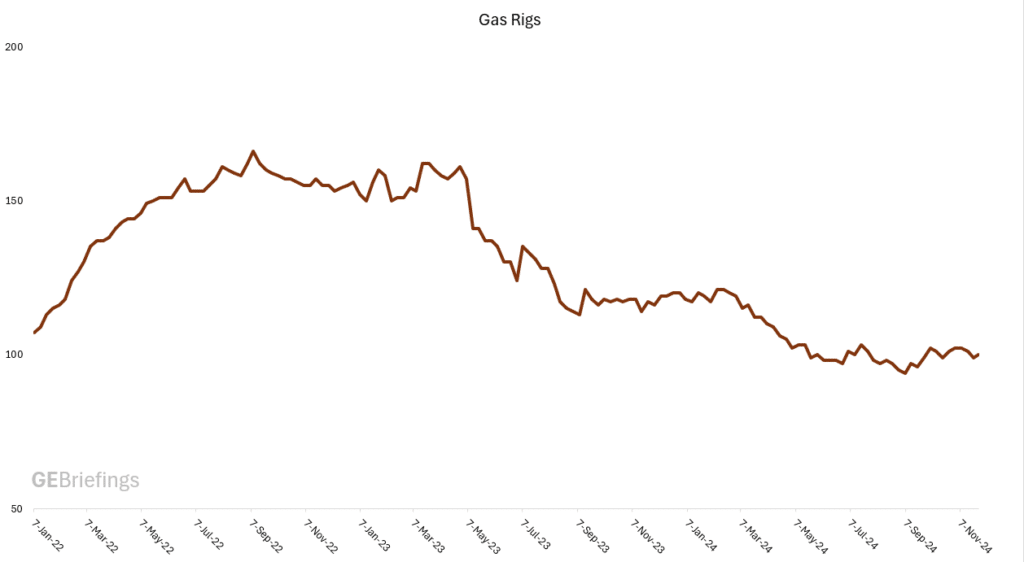
Figure 6. Total Active Rigs in the U.S. Decreased by One at 582.
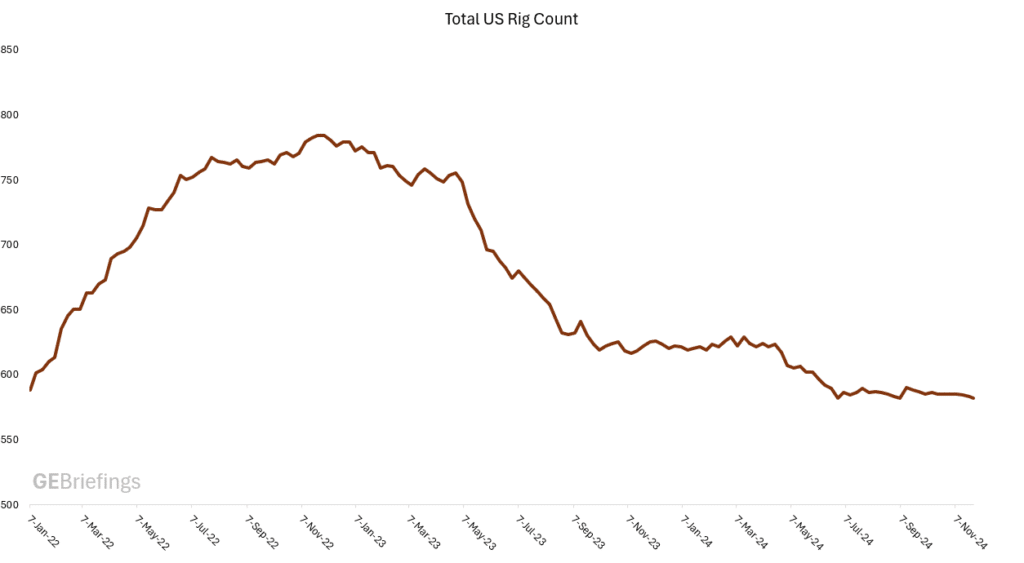
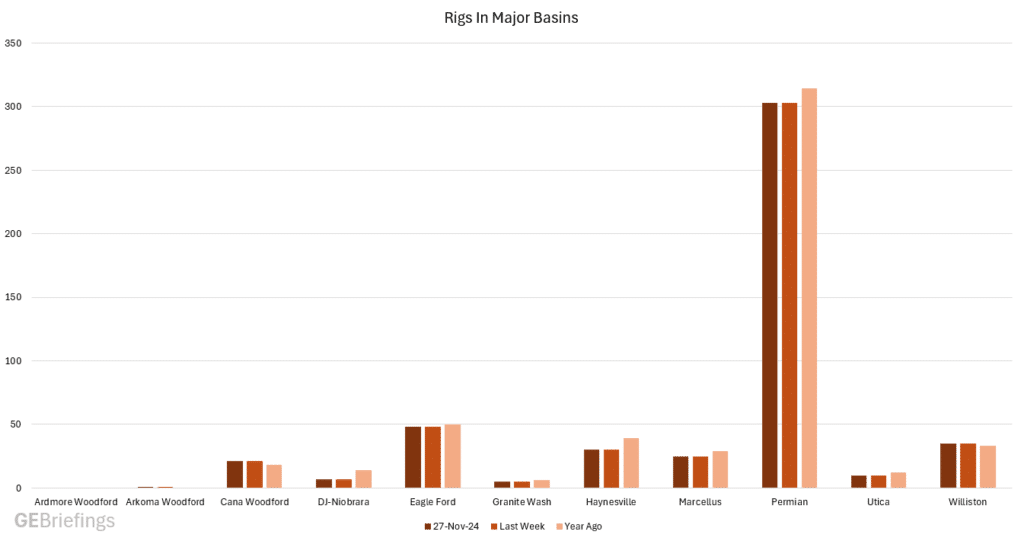
Figure 6. Rig Count in Major Basins.
Baker Hughes has issued the rotary rig counts as a service to the petroleum industry since 1944, when Baker Hughes Tool Company began weekly counts of U.S. and Canadian drilling activity. Baker Hughes initiated the monthly international rig count in 1975. The North American rig count is released weekly at noon Central Time on the last day of the work week.
| New Data | Previous Week | Change +/- |
US Production | 13.51 million bpd | 13.49 million bpd | +20 Kbpd |
Crude Stocks Excluding SPR | 428.4 million barrels | 428.4 million barrels | -5.1 million barrels |
Crude Stocks Including SPR | 815.2 million barrels | 818.8 million barrels | -3.6 million barrels |
Refinery Inputs | 16.91 million bpd | 16.29 million bpd | -620 Kbpd |
Active Rigs in the US | 582 Active Rigs | 583 Active Rigs | -1 |


