With May 2023 in the rear-view mirror, we can ascertain that it was a month of big energy headlines reflecting on a surprise cut of 1.16 million barrels per day from Saudi Arabia and other OPEC+ producers at the start of April.
Volatility has dominated the oil price in recent months and the voluntary cut from OPEC+ producers was aimed at supporting market stability. This is the second OPEC+ cut since US president Joe Bidens visit to Saudi Arabia in July 2022.
Looming bank crisis and risk of global recession is weighing heavy on the global oil market, and despite draws in US inventory oil price is still in a downward trend. May EIA data, shows a draw in US oil inventories, despite a 5 Mbbl build in the week ending May 1
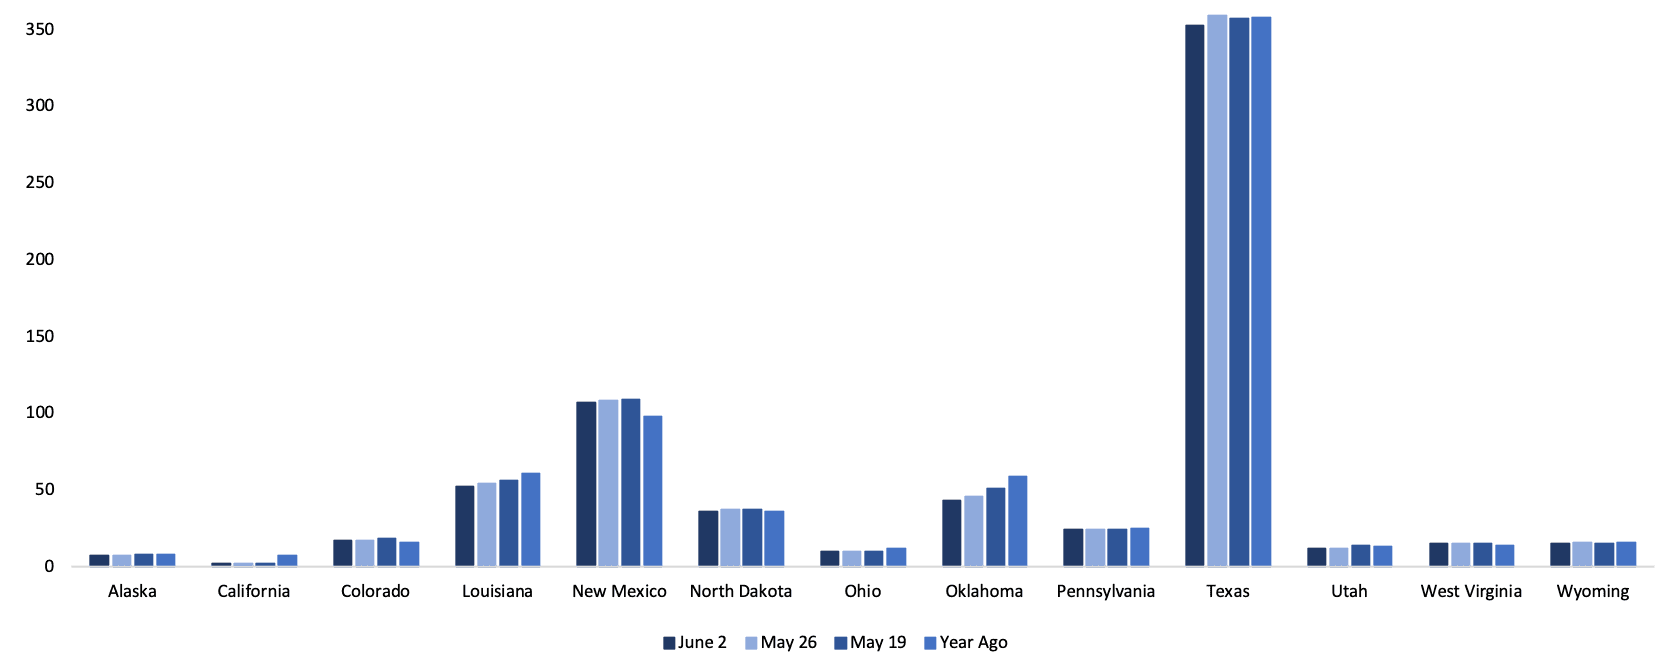
The U.S rig count is continuing to decline and number of active rigs in the U.S is now almost 5 % (31 rigs) lower than a year ago. The first count in June showed a decline of 15 rigs drilling I oilfields, and a unchanged count for rigs drilling for gas.
Saudi Arabia announced a new voluntary cut of 1 Mbpd for July only, but vocal on extending the cut further
Signal deck Bullish or Bearish
Annonse
Preface
With May 2023 in the rear-view mirror, we can ascertain that it was a month of big energy headlines reflecting on a surprise cut of 1.16 million barrels per day from Saudi Arabia and other OPEC+ producers at the start of April.
Volatility has dominated the oil price in recent months and the voluntary cut from OPEC+ producers was aimed at supporting market stability. This is the second OPEC+ cut since US president Joe Bidens visit to Saudi Arabia in July 2022.
Looming bank crisis and risk of global recession is weighing heavy on the global oil market, and despite draws in US inventory oil price is still in a downward trend. May EIA data, shows a draw in US oil inventories, despite a 5 Mbbl build in the week ending May 1
The U.S rig count is continuing to decline and number of active rigs in the U.S is now almost 5 % (31 rigs) lower than a year ago. The first count in June showed a decline of 15 rigs drilling I oilfields, and a unchanged count for rigs drilling for gas.
Saudi Arabia announced a new voluntary cut of 1 Mbpd for July only, but vocal on extending the cut further
Signal deck Bullish or Bearish
Oil price
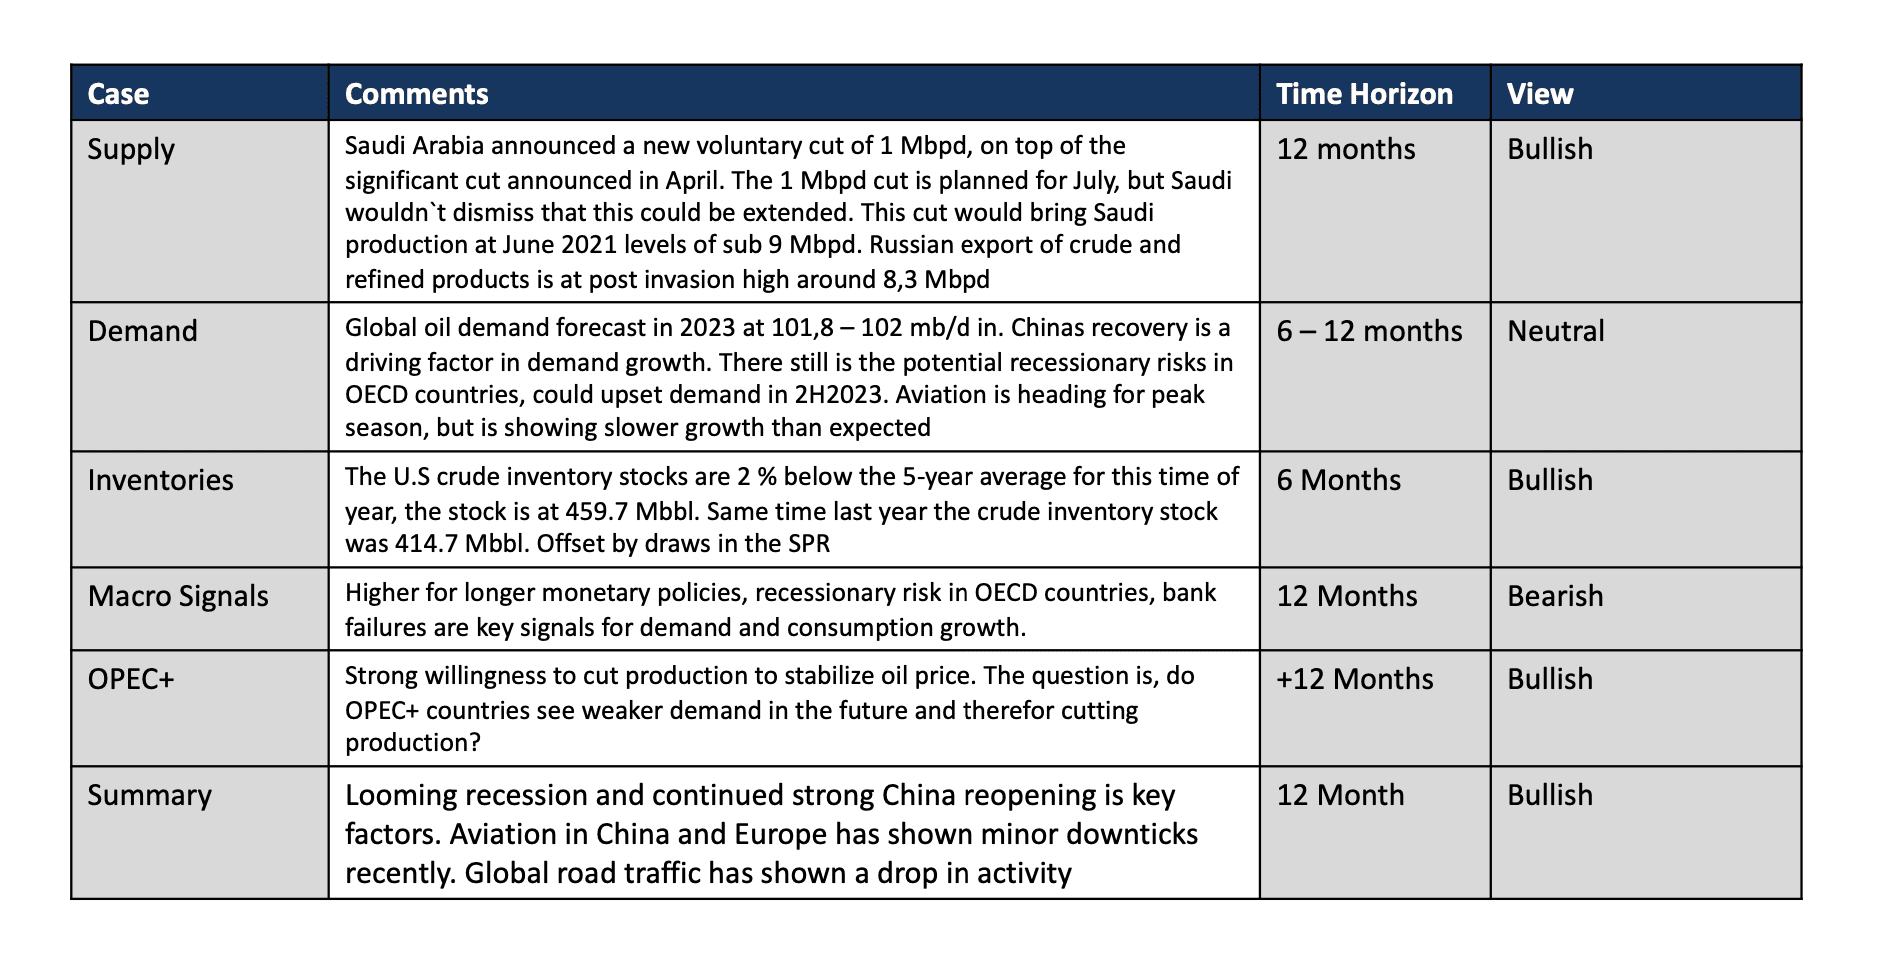
The oil price surged after the surprise voluntary cut from OPEC+ oil producers in early April.
Brent crude, the global benchmark, jumped 5.31% to $84.13 a barrel, while WTI, the US benchmark, rose 5.48% to $79.83. Both were the sharpest price rises in almost a year. Since then the oil price are back below pre-announcement levels. We think the macro-pressure globally and uncertainty in Chinas recovery weighs down the oil price and the tight fundamentals is not yet priced in. It seems like Saudi led OPEC+ willingness to cut production in support of oil price is stronger than first assumed.
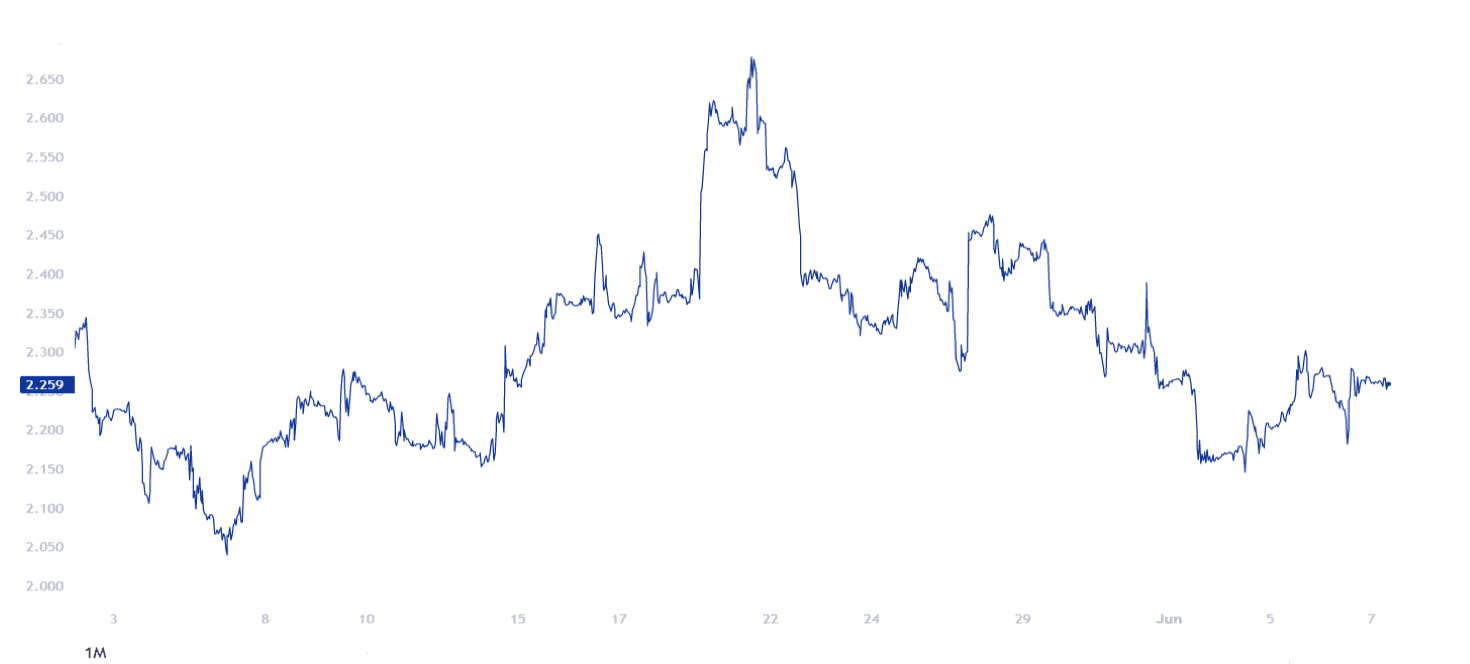
Figure 1: Brent Crude Price movements May
Price movements Brent and WTI, month of May. The announcement of Saudis voluntary cut of 1 Mbpd planned for July is likely to deepen the market deficit to more than 3 Mbpd, this can add pressure to the upside as we move in to peak season and further in to the second half of 2023
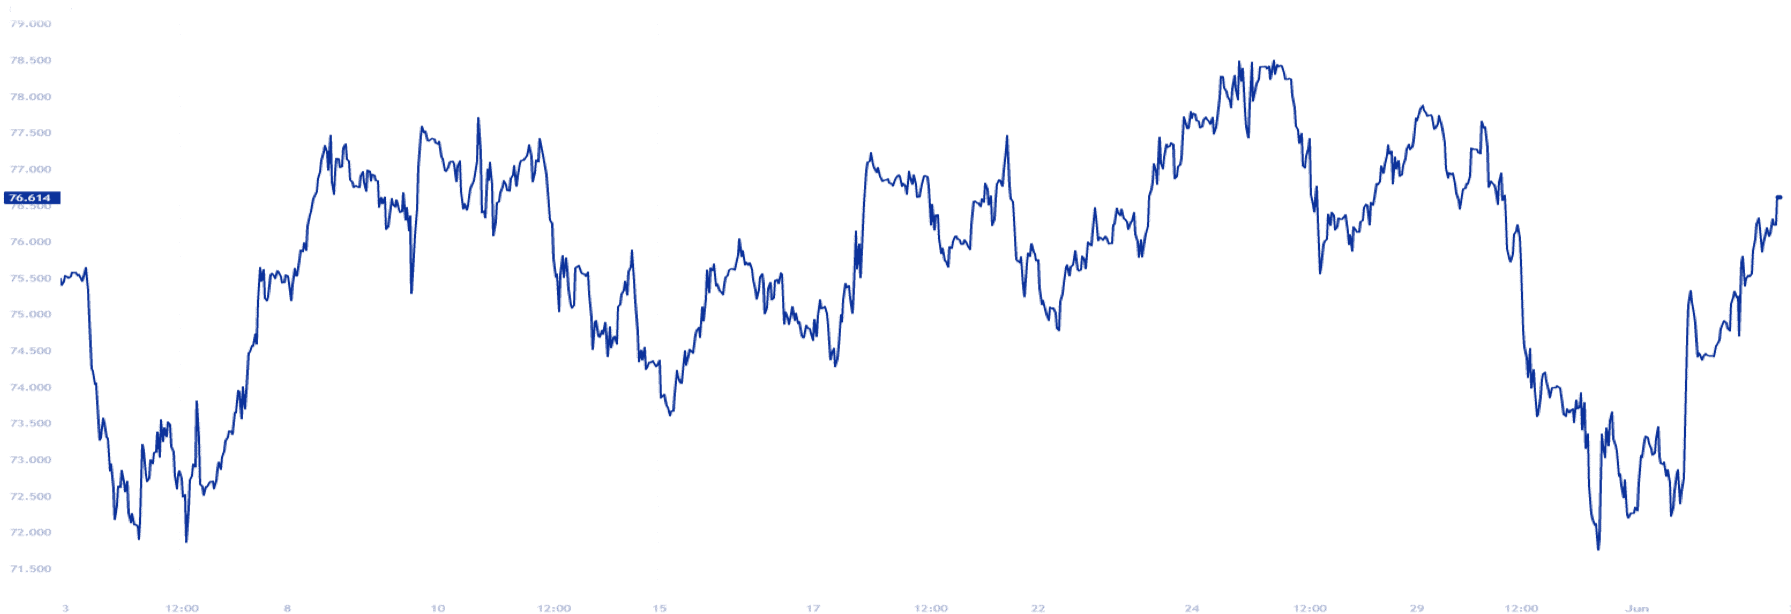
Figure 2: Brent Crude and West Texas Intermediate Price movements May
Brent and West Texas Intermediate future curve has flattened but contracts are still in a slight backwardation (If the futures curve is downward sloped). Backwardation tends to occur when commodity markets are undersupplied. Falling oil inventories and dwindling spare capacity caused by oil demand reaching a new record high this year are supporting a steeper curve in the future. Front-month price volatility is historically very low when the Brent futures curve is flat, since late 2022, however, the flat futures curve has coincided with high volatility in Brent’s daily returns.
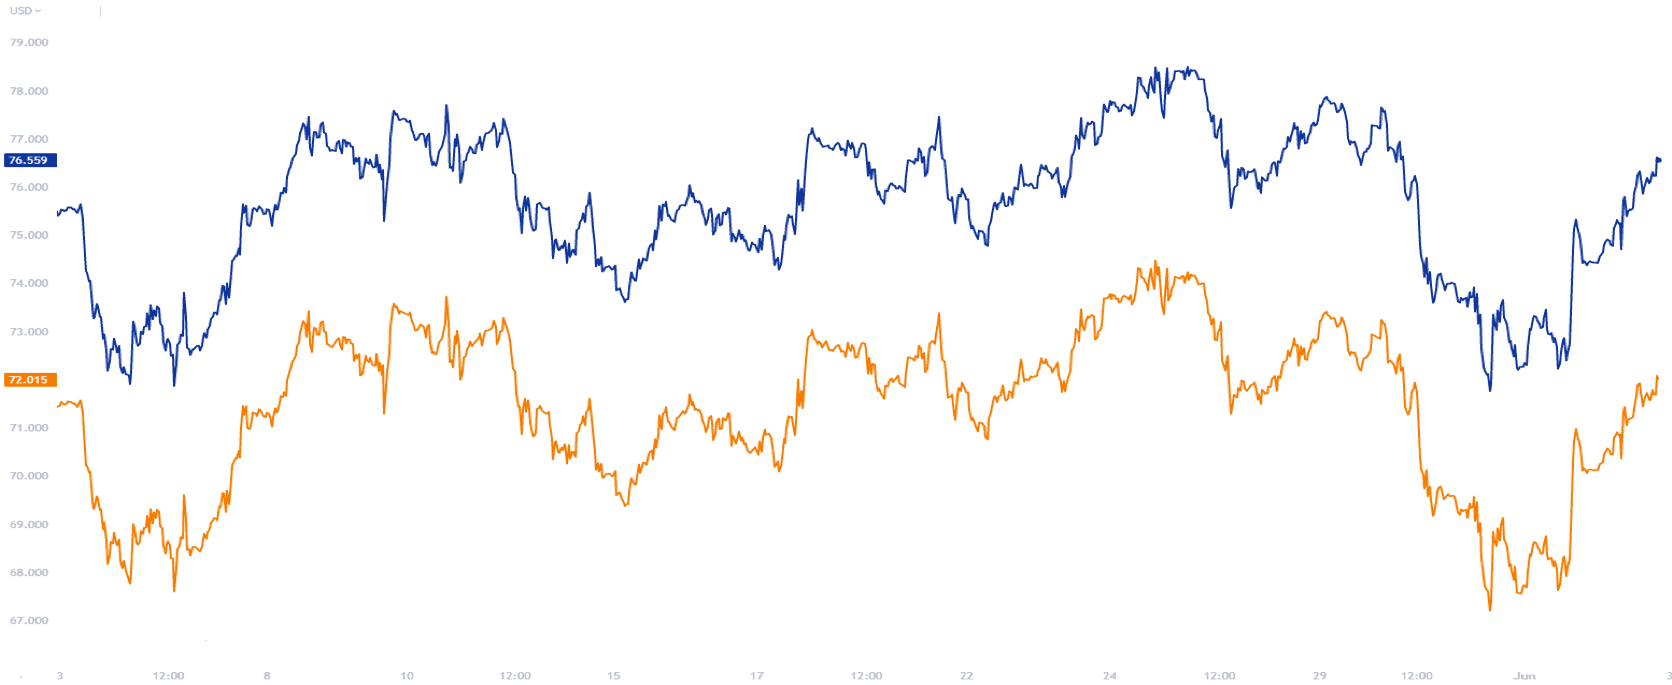
Figure 3: Brent and West Texas Intermediate Future Contracts
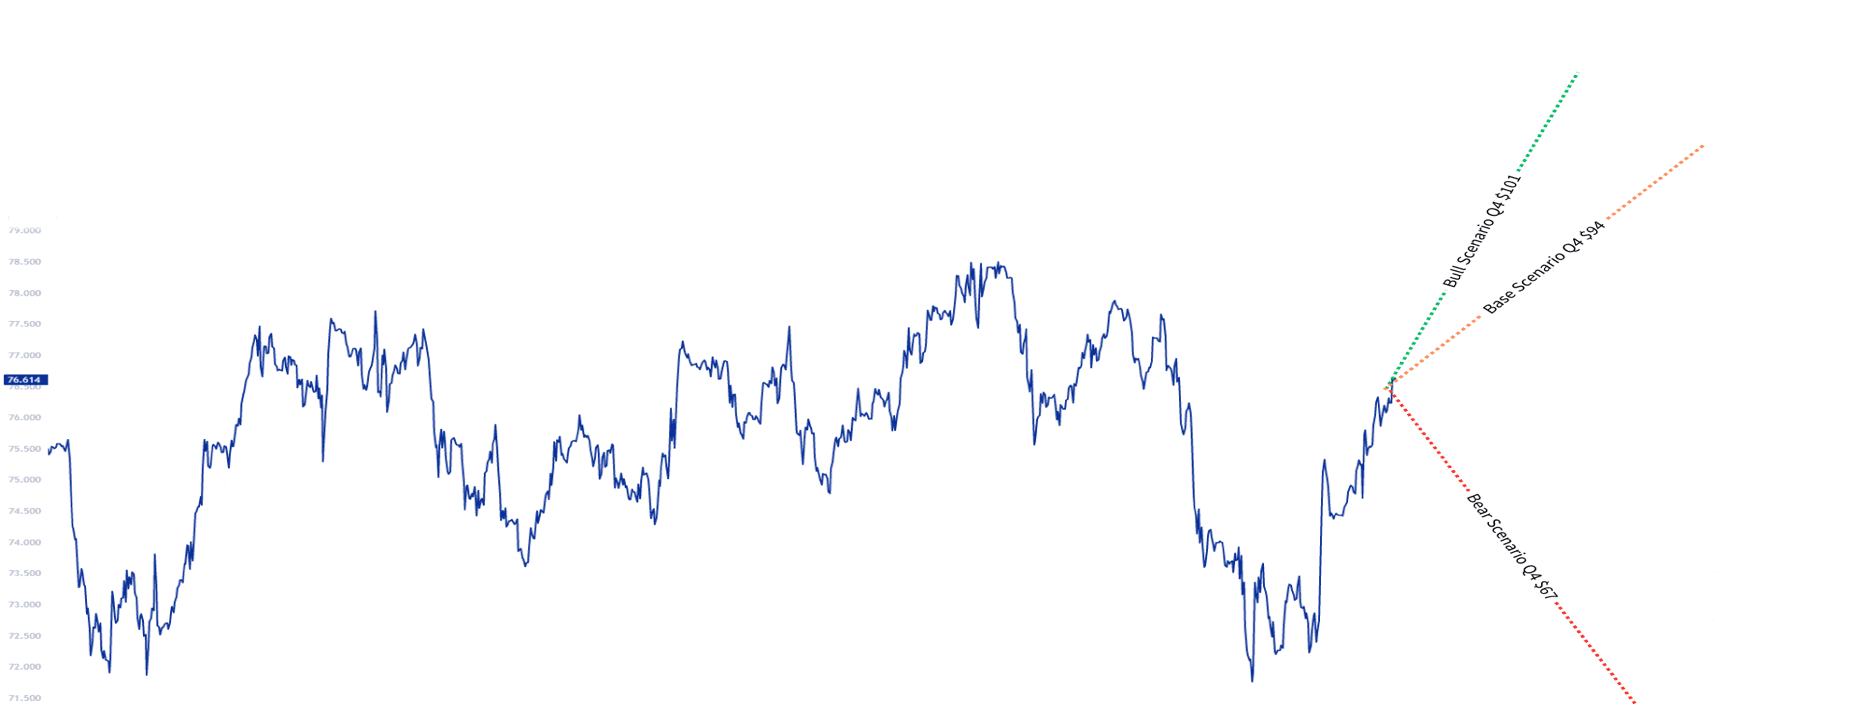
Our base scenario is that Brent will average around 94 USD/bbl in Q4 2023. We predict OPEC+ will continue to support price level until the fundamentals Can no longer be overlooked.
Annonse
The $ 94 estimate is revised down from previous estimates of around 95 USD/bbl.
Our bull scenario is that Brent will average around 101 USD/bbl. Our fundamentals for crude and liquids remain tight, and if looming recession is short lived, and the deficits in the market continue to deepens
We believe that Brent could hit our bull case.
Our bear scenario is that Brent will average around 67 USD/bbl. If demand due to recession keeps falling and OPEC+ doesn’t protect the price we could see
Price average even lower than 69 USD/bbl.
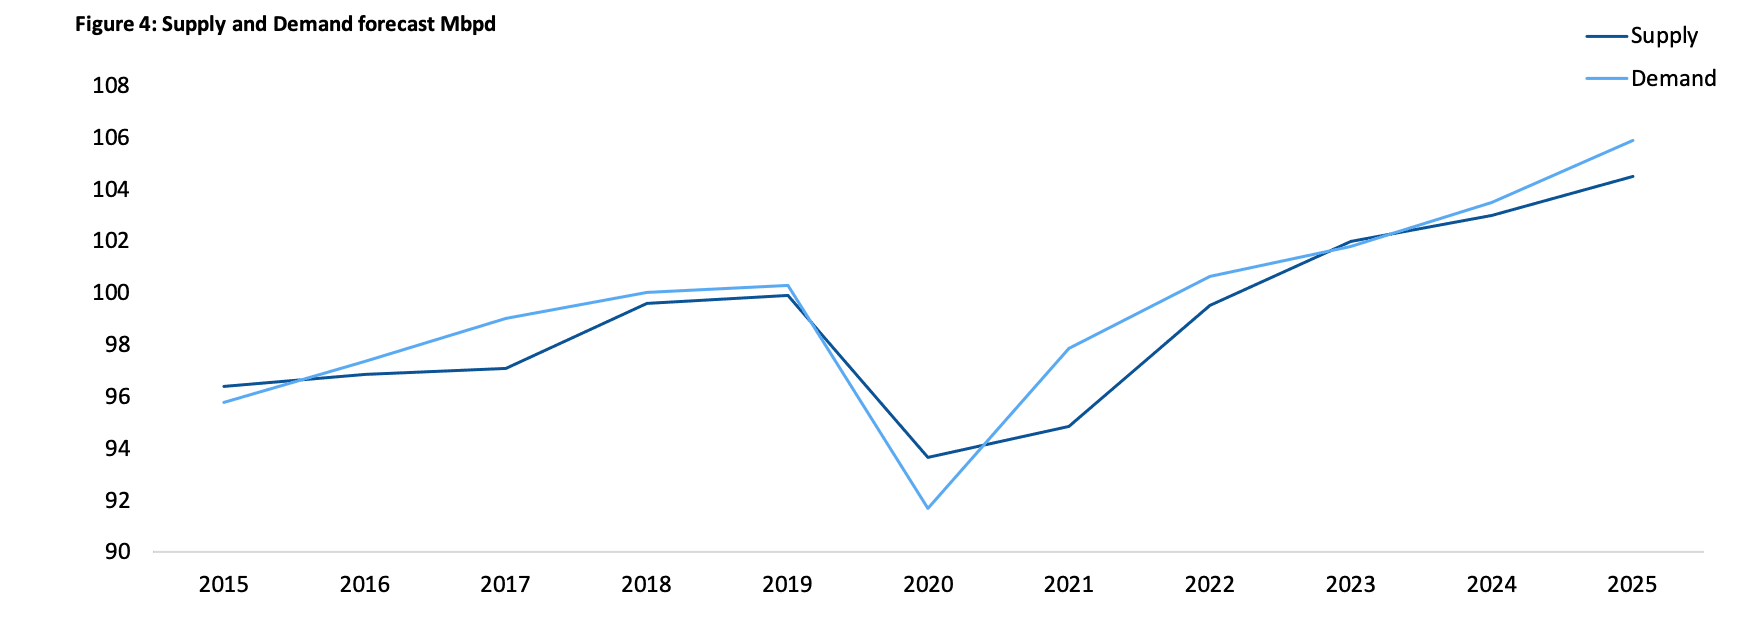
Figure 4: Bull, Bear and Base Scenario. Brent Crude
Supply
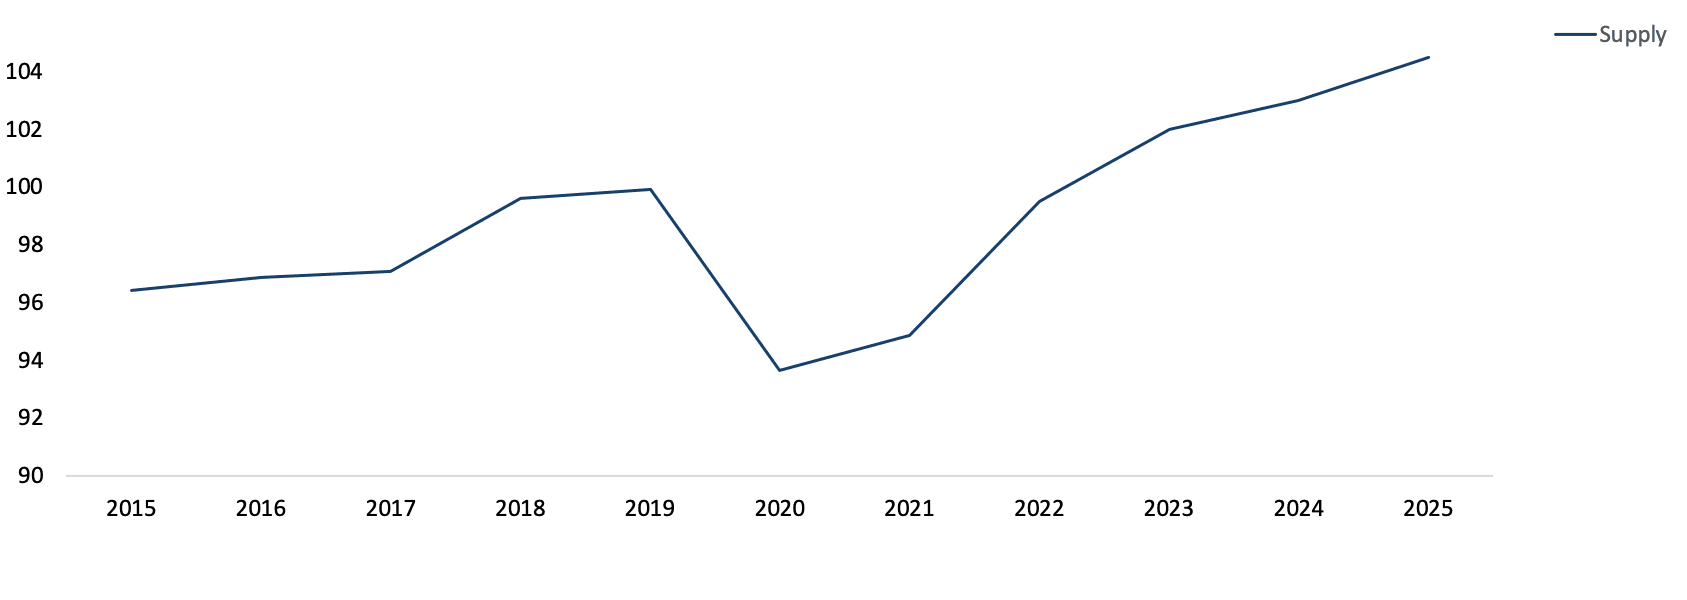
Russian exports of crude and refined oil products edged up in April to a post-invasion high of 8.3 Mbpd. Shipments of crude oil increased by 250 kb/d, offsetting a decline in product exports of 200 kb/d. Estimated oil export revenues increased by $1.7 billion to $15 billion on the back of higher crude oil exports and a narrower Urals discount. We expect a supply growth of 1,2- 1,4 Mbpd. Saudi Arabia announced a new voluntary cut of 1 Mbpd, on top of the significant cut announced in April. The 1 Mbpd cut is planned for July, but Saudi wouldn`t dismiss that this could be extended. This cut would bring Saudi production at June 2021 levels of sub 9 Mbpd.
Annonse
Figure 5: Supply forecast Mbpd
Demand
Global oil demand is forecast to rise to an average 101,8 – 102 mb/d in 2023. An increase of 2.0 – 2.2 mb/d year-on-year. China`s recovery is the main driving factor in global demand growth and the major consumer is showing positive signals. There still is the potential recessionary risks in OECD countries, caused by tight monetary policies by central banks, this could upset demand in 2H2023. Aviation is heading for peak season, but is showing slower growth than expected, but could still be a main driver for demand going forward.
U.S inventories
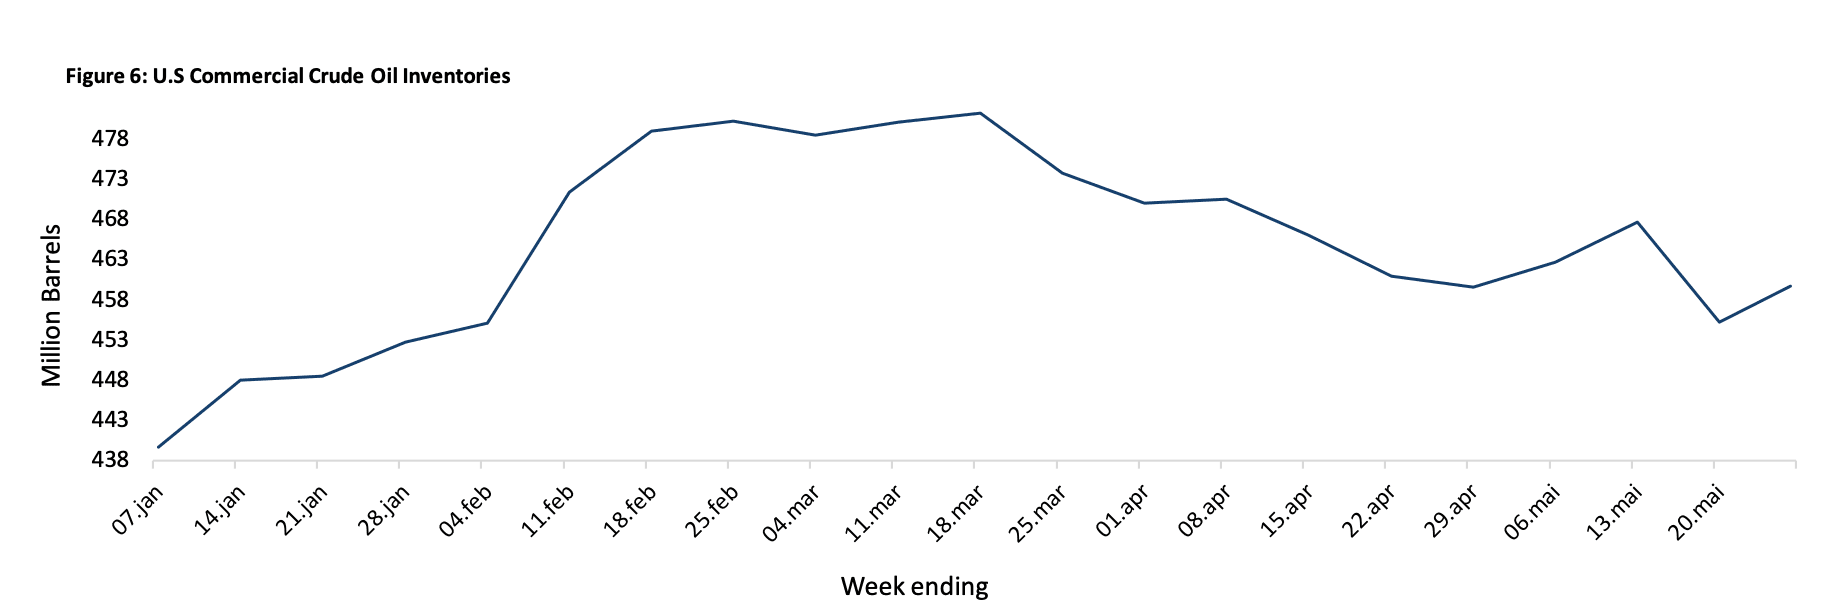
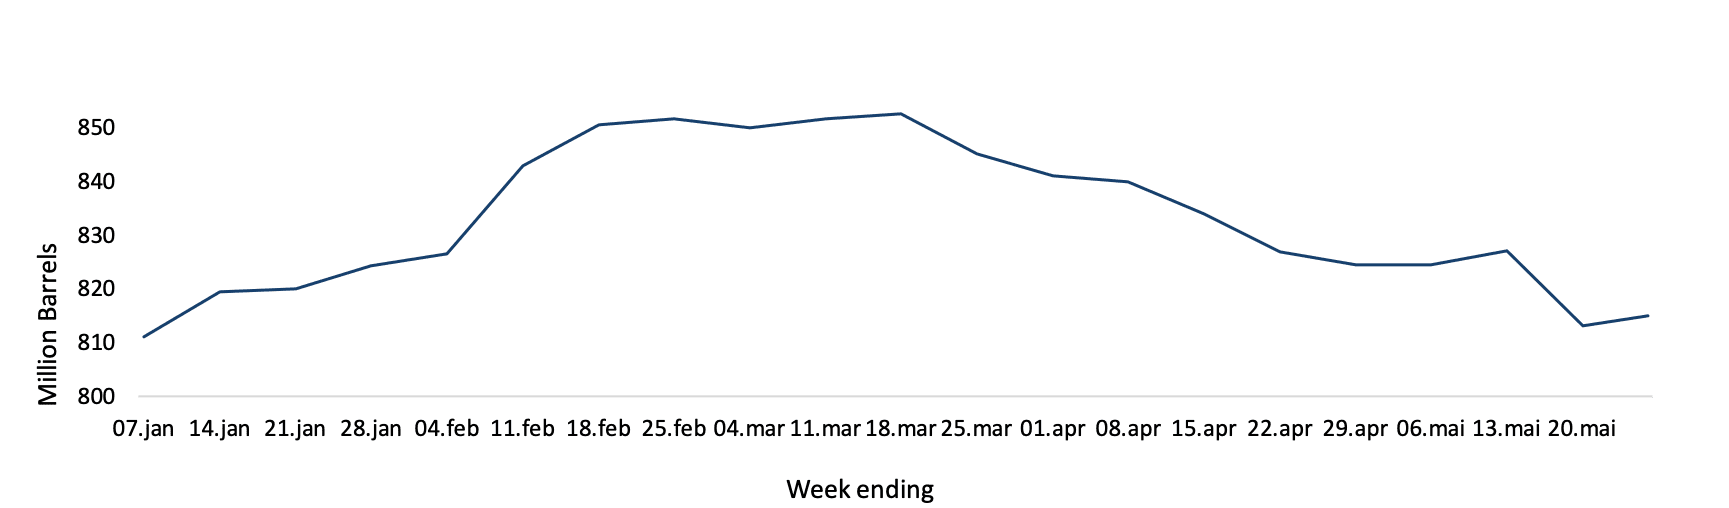
U.S. commercial crude oil inventories, excluding the strategic petroleum reserve inventories are still higher now than at the start of the year at 439,6 Mbbl, although we have seen a steady draw since mid-March with some exceptions. The stocks are 2 % below the 5-year average for this time of year and according to data from the EIA, Energy Information Administration, the stock is at 459.7 Mbbl. Same time last year the crude inventory stock was 414.7 Mbbl. If you include the SPR in the mix we have a total of 815,1 Mbbl on stock. A significant draw from last year at 951, 8 Mbbl
Figure 6: U.S Commercial Crude Oil Inventories
The latest data from EIA shows a significant build in the commercial crude inventories (4,5Mbbl), but partly offset by the draw of the SPR (2,6Mbbl)
Figure 7: U.S Commercial Crude Oil Inventories Including the SPR
Annonse
U.S Rig market
The blurry macroeconomic environment have put pressure on commodity prices and smaller, private players are feeling lower oil and gas prices the most and they seem to be slowing down drilling operation. The plunged of oil rigs from Baker Hughes 6/2- 2023 Rig count is the sharpest reduction since the 2020 pandemic era. Larger operators in oil and gas fields shows caution as oilfield cost remains elevated and market outlook continues to look blurry. Draw in U.S oil rigs 6/2 -2023 at 15, and gas rigs remained unchanged.
Figure 8: Rotary Rig Count by State
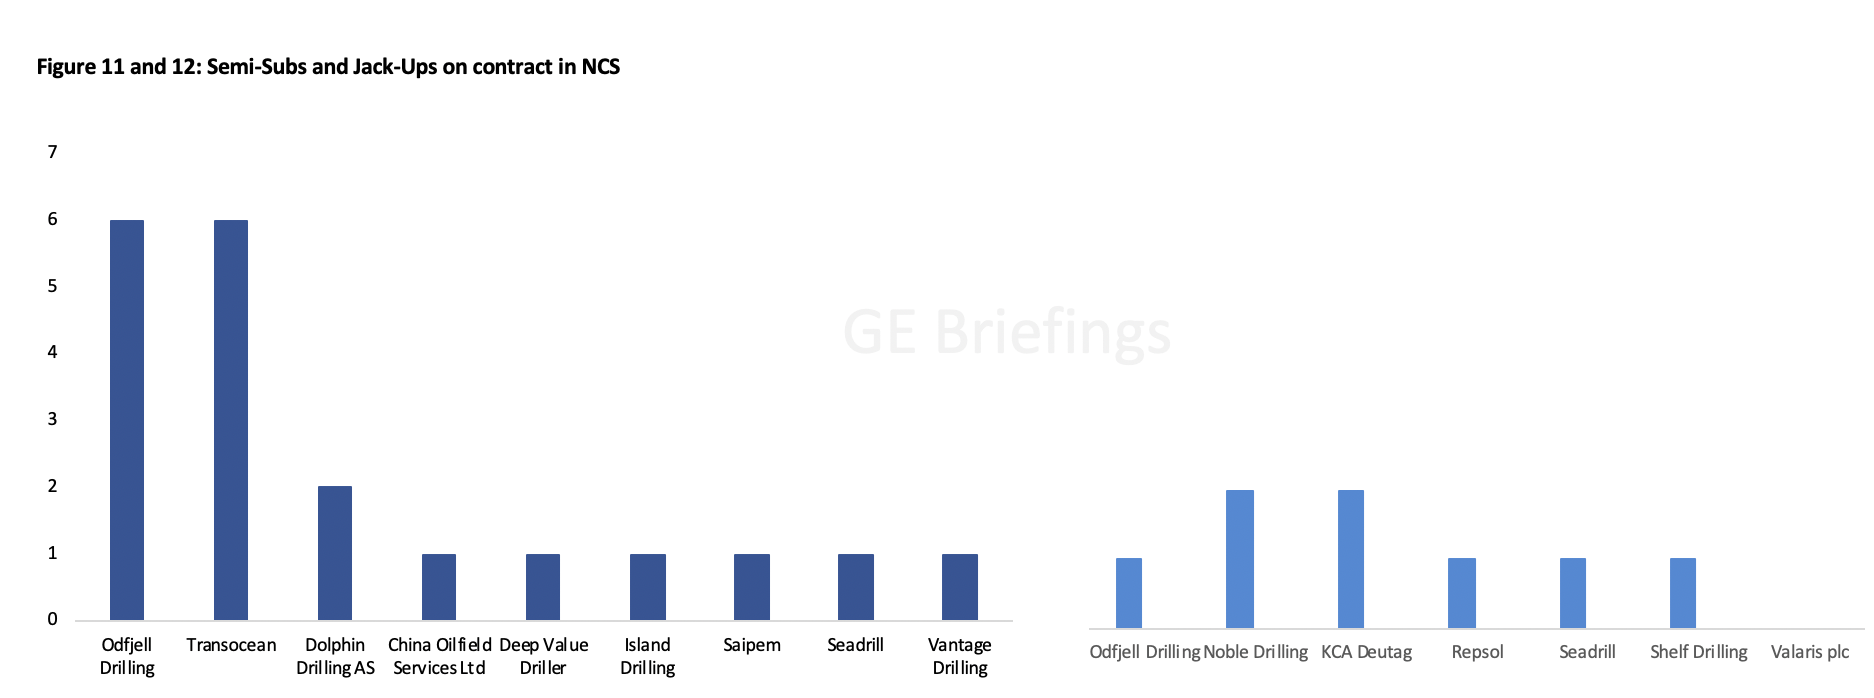
NCS Rig market
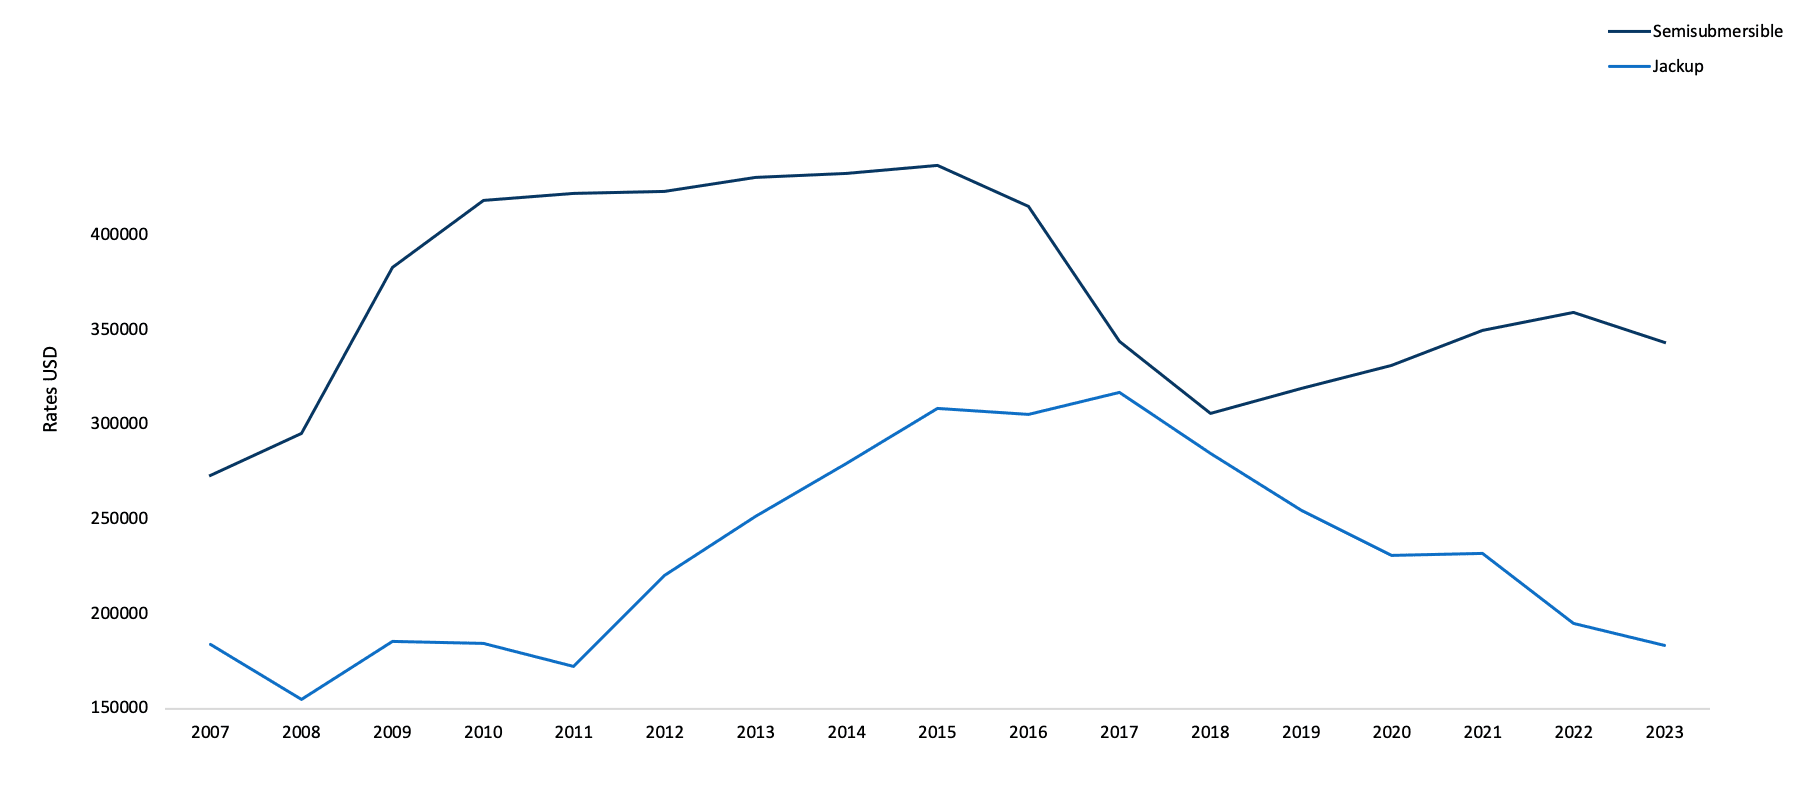
While the land rig market tends to be more volatile and more sensitive to short term price swings, the offshore market is less effected by short term swings in oil and gas prices. We see a tight rig market in the NCS in the future, as rigs get older and fewer newer is getting built. The major operators in NCS has signaled an increased number of exploration wells being drilled in the future
Figure 9: Rig Rates Semi-Subs and Jack-Ups
Equinor is the biggest player in the Norwegian Continental Shelf by far and the company has announced that they will drill between 20 and 30 exploration wells a year going forward. Around 80 percent of the exploration wells will be drilled in known, mature areas. Discoveries near existing infrastructure require less volume to be commercially developed and can be quickly put on stream and with low CO2 emissions. Equinor is set to maximize the value creation from existing infrastructure that has been developed over a long period on the NCS.
GAS market
Annonse
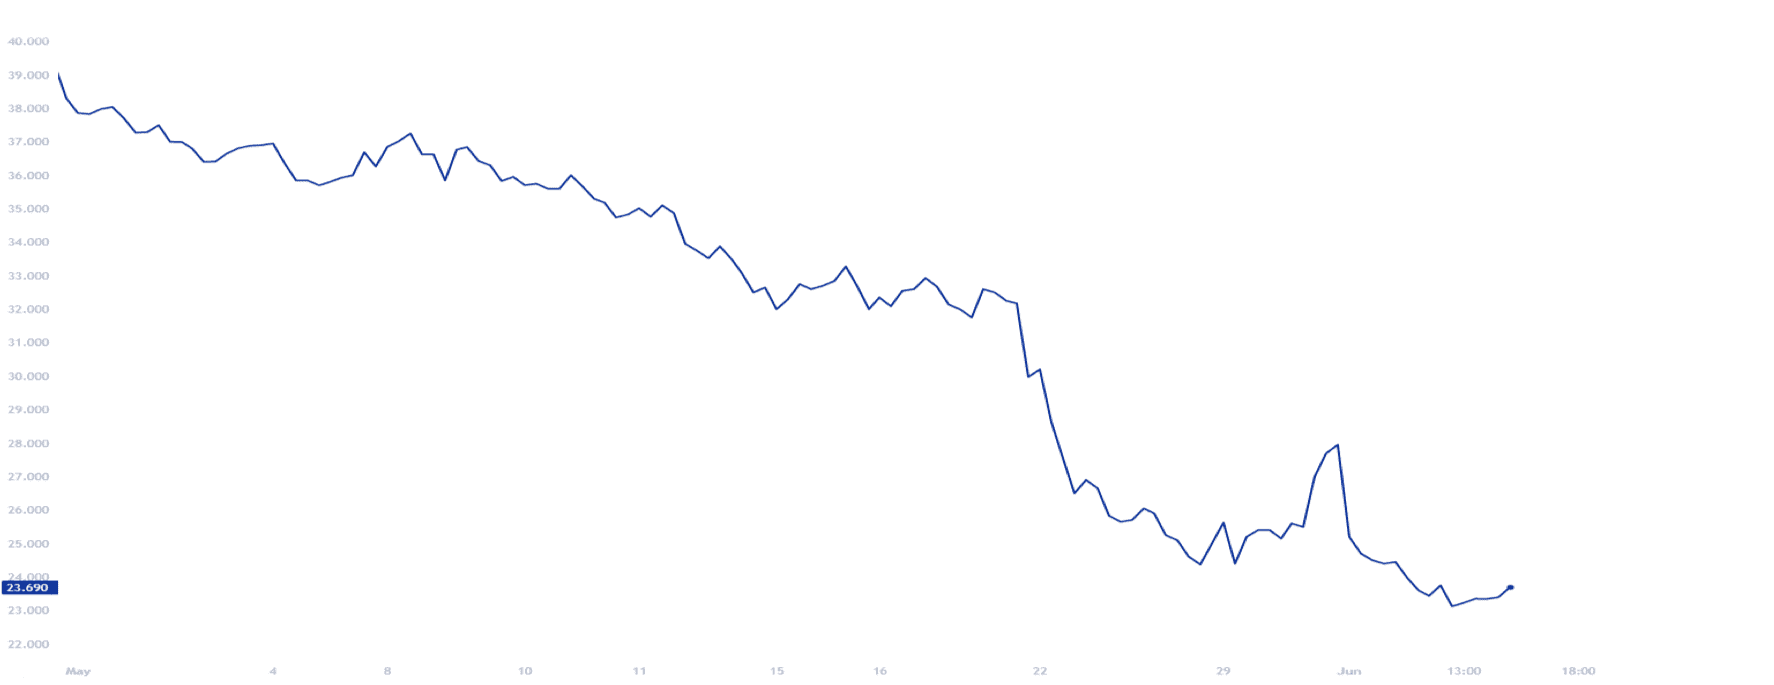
The European storage levels were around 70% full, about 789 TWh of capacity in inventories. Same time a year ago the European storage were around 50% full at 550 TWh. High level storage keeps a weight on gas prices and EU nations is in no rush to refill inventories to meet their 90% inventory target by November 2023. The maintenance of TurkStream, Norwegian pipelines and the outage at Hammerfest has failed to push prices higher, showing a weakness in demand due to strong storage levels.
Figure 13: Dutch TTF Price Chart
Storage levels increased to 2,446 Bcf as of 26 May, which is 17% higher than the five-year average and 29% more than during the same period last year. The injection of by 110 Bcf is 10% higher than the five-year average injection and higher than the 82 Bcf injection last year. The high storage levels is suppressing the HH price
Sources
Disclaimer
This report is under no circumstances intended to be used for or considered as investment advice. This report is to be used as information and a general market guidance. The author, GE Briefings and Investornytt cannot guarantee that the information from sources is without incentives, but the author have taken considerable care to ensure that, and to the best of his knowledge, material information contained in the report is in accordance with the facts and contains no omission likely to affect its understanding. Please note that this report is the authors own research, opinions and conclusions, and the readers is recommended to draw their own conclusions based on other sources than this report, the facts and market picture can change in an instant and therefor the reader must do their own due diligence. The author, GE Briefings and Investornytt cannot be held responsible for the readers investments based on this report.
En vandrelysten finansnerd med tydelige spor av graphomania og bibliofili i blodet. Hans første møte med markedet bortsett fra noen kornete aksjekurser på 28" tekst TV, var igjennom Odin fondene i 2000 – 2001. Der diversifiserte han pengene ut på ODIN Offshore, ODIN Norden og ODIN Finland, helt tilfeldig. Etter å først dyppet stortåen forsiktig ned i vannet ble han etter hvert hektet. I 2002 gjorde han sin første handel i en enkeltaksje, Selskapet hadde ticker symbolet, STL- eller Statoil på folkemunne. Der kastet han alle kortene i panikk etter en liten korreksjon noen måneder senere, han elsket det! Nå kombinerer han sine to hobbyer, skriving og finans og smelter dem sammen til en lidenskap.


Nylige artikler
Trump-selskap vil selge Wall Street lynrask tilgang til Truth Social
Nyboligtrøbbel ga Pareto Bank-smell: Tapene nær tolvdoblet
Tropenatt for andre natt på rad
540 millioner kroner i strømstøtte til bedrifter i fjor
Soiltech forlenger kontrakt i Nederland til 2028
Urolig ventet åpning på Oslo Børs
Trump skal tale i natt – bekymring blant partifeller
Mest leste artikler
Zenith Energy kan doble seg: voldgift, sol og uran løfter aksjen
Snatched solgte for 23 millioner på seks måneder – henter vekstkapital for shapewear-satsing
Zenith Energy kan selge italiensk solportefølje for 12 millioner euro
Zelluna før kliniske data i 2026: Namir Hassan om ZIMA-101, ZI-MA4-1 og TCR-NK
VAR-skandalen i Norges VM-exit: Derfor ville videodømming aldri overlevd i finansmarkedene
(+) Ukens aksje uke 10 - denne kan stige 100%! - Investornytt
EQVA satser på forsvar og datasentre med nye storavtaler