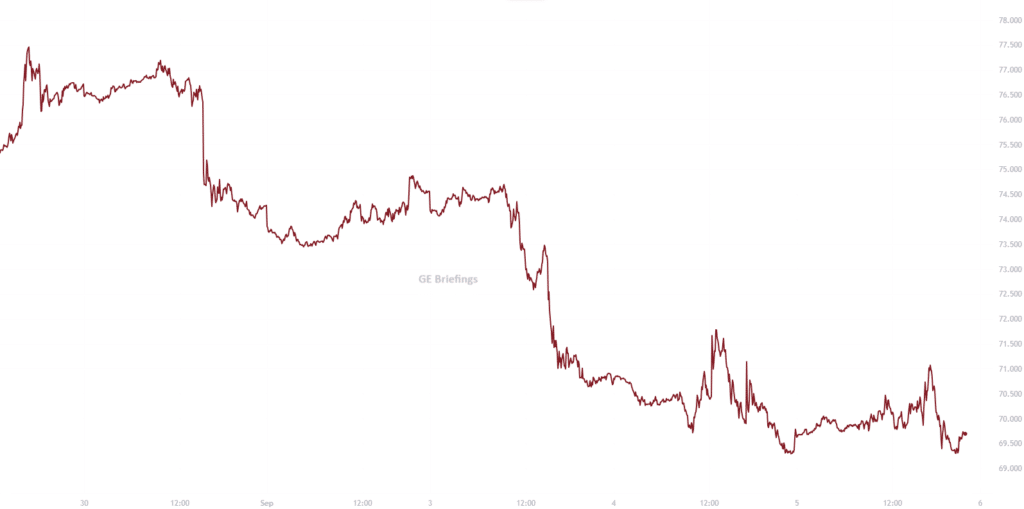
A turbulent week for crude prices is now in the back-view mirror, with more unrest to come. With OPEC+ close torelease more crude barrels in the market and week macro signals, crude prices plummeted like a rock in the sea, passing key price areas on the way down. The bearish pressure came in on multiple fronts, leaving traders shaky at best.
China’s official purchasing managers index (PMI) for manufacturing came in at a six-month low in August and was firmly in contraction, and signs that an UN-brokered deal to end Libya’s damaging oil blockade could be in sight. Representatives from Libya’s Parliament, the House of Representatives and another state body, the Higher Council of State, agreed to hold talks over the next five days on appointing a new central bank governor and board members. Control of Libya’s central bank is at the heart of the latest dispute in the country. On top of this a looser global balance is expected as the bullish demand forecast by OPEC struggles to materialize.
Figure 1. WTI Falls Below the $70 Mark on Bearish Pressure
US Crude inventories and production.
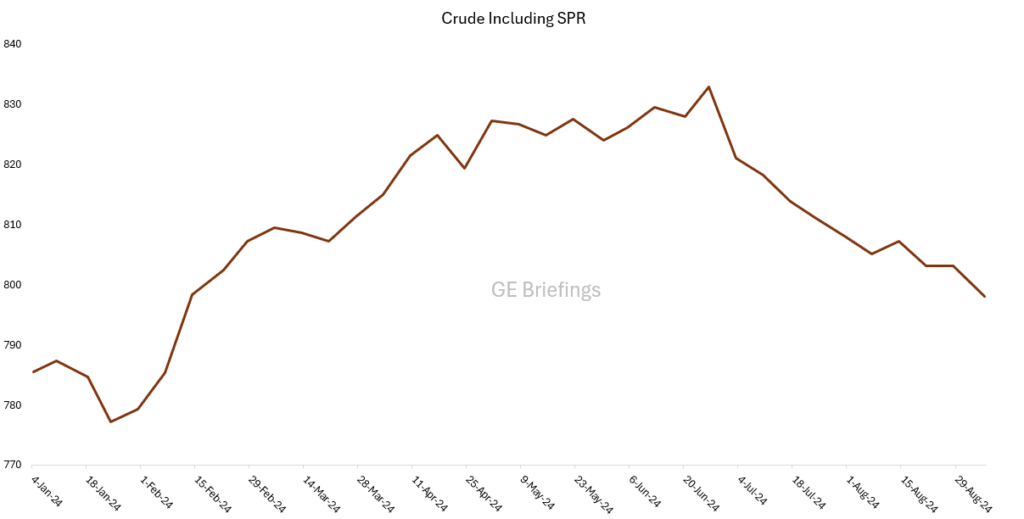
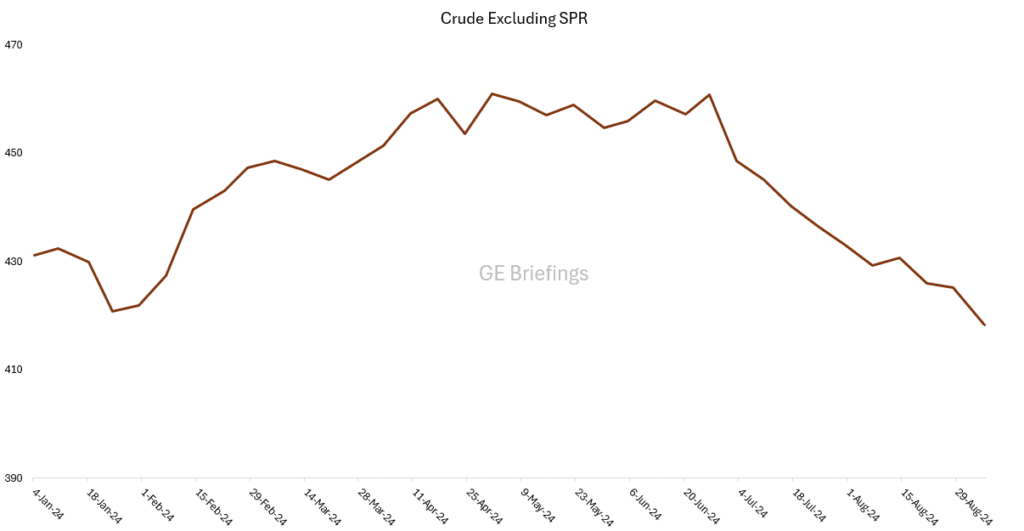
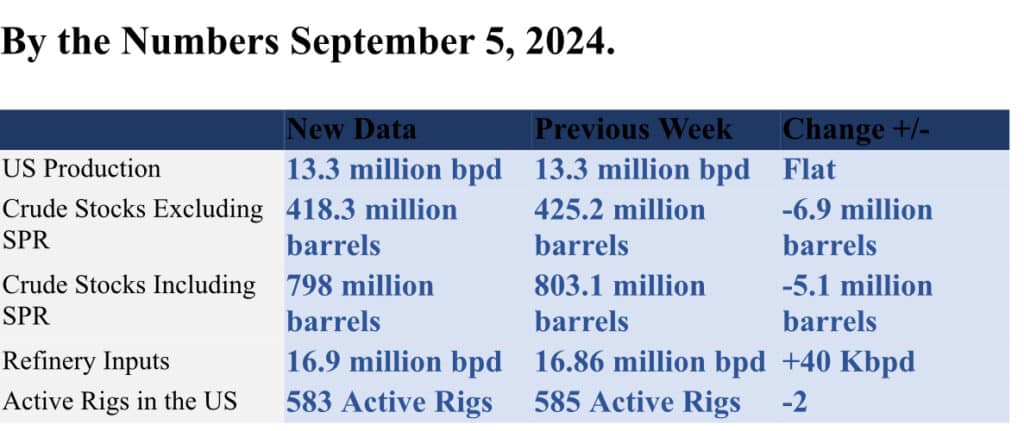
US commercial crude oil inventories decreased by a massive6.9 million barrels from the previous week. That is asignificantly higher draw than the expected 1 million barrel-draw forecasted by market experts. At 418,3 million barrels excluding SPR, U.S. crude oil inventories are about 5 percentbelow the five-year average for this time of year but 2.3 million barrels higher than a year ago. U.S. crude oil refinery inputs averaged 16.9 million barrels per day during the week ending August 30, 2024, which was a few barrels per day more than the four-week average. Refineries operated at 93.3% of their operable capacity last week.
Figure 2. US Crude Stocks including SPR at 798 million barrels.
Figure 3. US Crude Stocks Excluding SPR at 418.3 million barrels.
US Rig Activity.
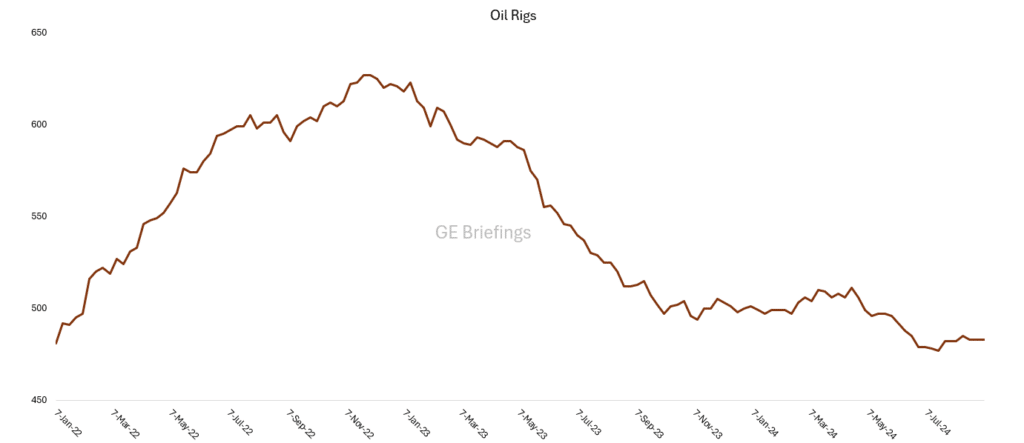
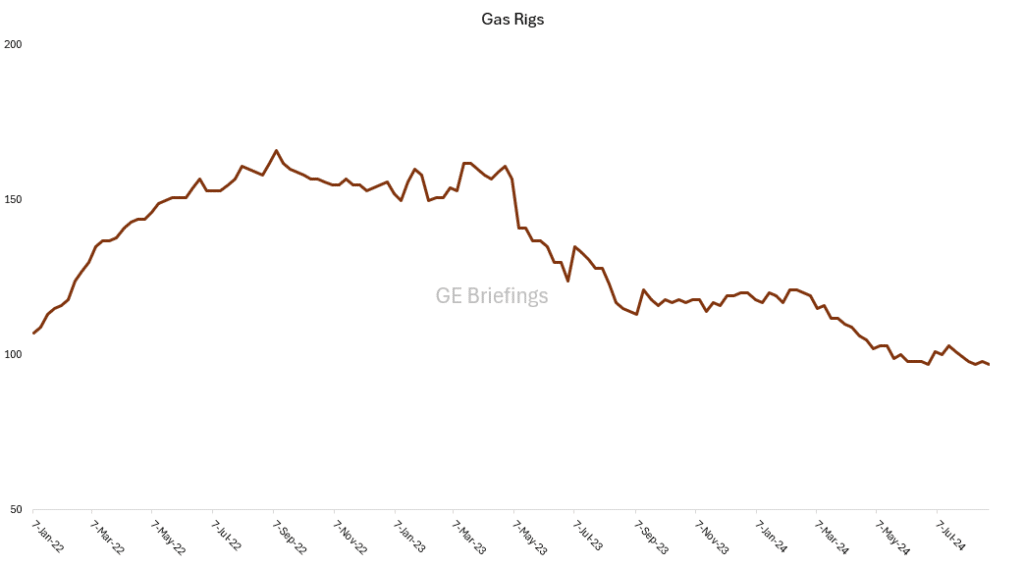
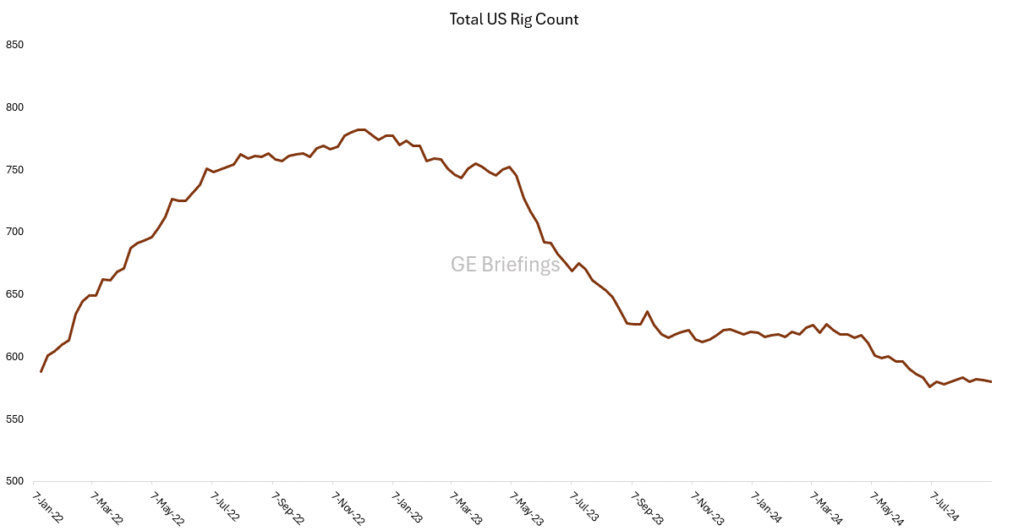
Last week the number of active rigs in the U.S dropped by two according to the Baker Hughes weekly rig count. Active oil rigs remained unchanged last week at 483, but active gas focused rigs continued to decline last week and dropped by two, to 95 rigs. The total of active rigs for the United States down from 585 to 583 including miscellaneous rigs, 48 rigs lower than a year ago.
Figure 4. Another Flat Week for Active Oil Focused Rigsat 483.
Figure 5. Another Weekly Decline in Active Gas Focused Rigs. Two Rigs Lower Than Previous Week.
Figure 6. Total Active Rigs in the U.S. Dropped by Two Last Week.
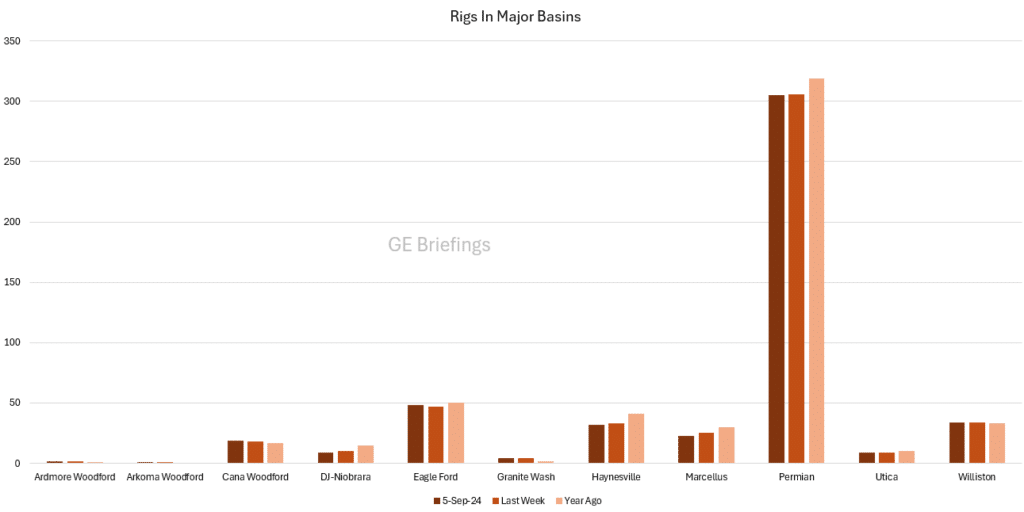
Figure 6. Rig Count in Major Basins.
Baker Hughes has issued the rotary rig counts as a service to the petroleum industry since 1944, when Baker Hughes Tool Company began weekly counts of U.S. and Canadian drilling activity. Baker Hughes initiated the monthly international rig count in 1975. The North American rig count is released weekly at noon Central Time on the last day of the work week.
Disclaimer
This report is under no circumstances intended to be used for or considered as investment advice. This report is to be used as information and a general market guidance. The author, GE Briefings and Investornytt cannot guarantee that the information from sources is without incentives, but the author has taken considerable care to ensure that, and to the best of his knowledge, material information contained in the report is in accordance with the facts and contains no omission likely to affect its understanding. Please note that this report is the authors own research, opinions and conclusions, and the readers is recommended to draw their own conclusions based on other sources than this report, the facts and market picture can change in an instant and therefor the reader must do their own due diligence. The author, GE Briefings and Investornytt cannot be held responsible for the readers investments based on this report.


